March 16th, 2023
Expert Series | Microservices Observability: Expert Best Practices
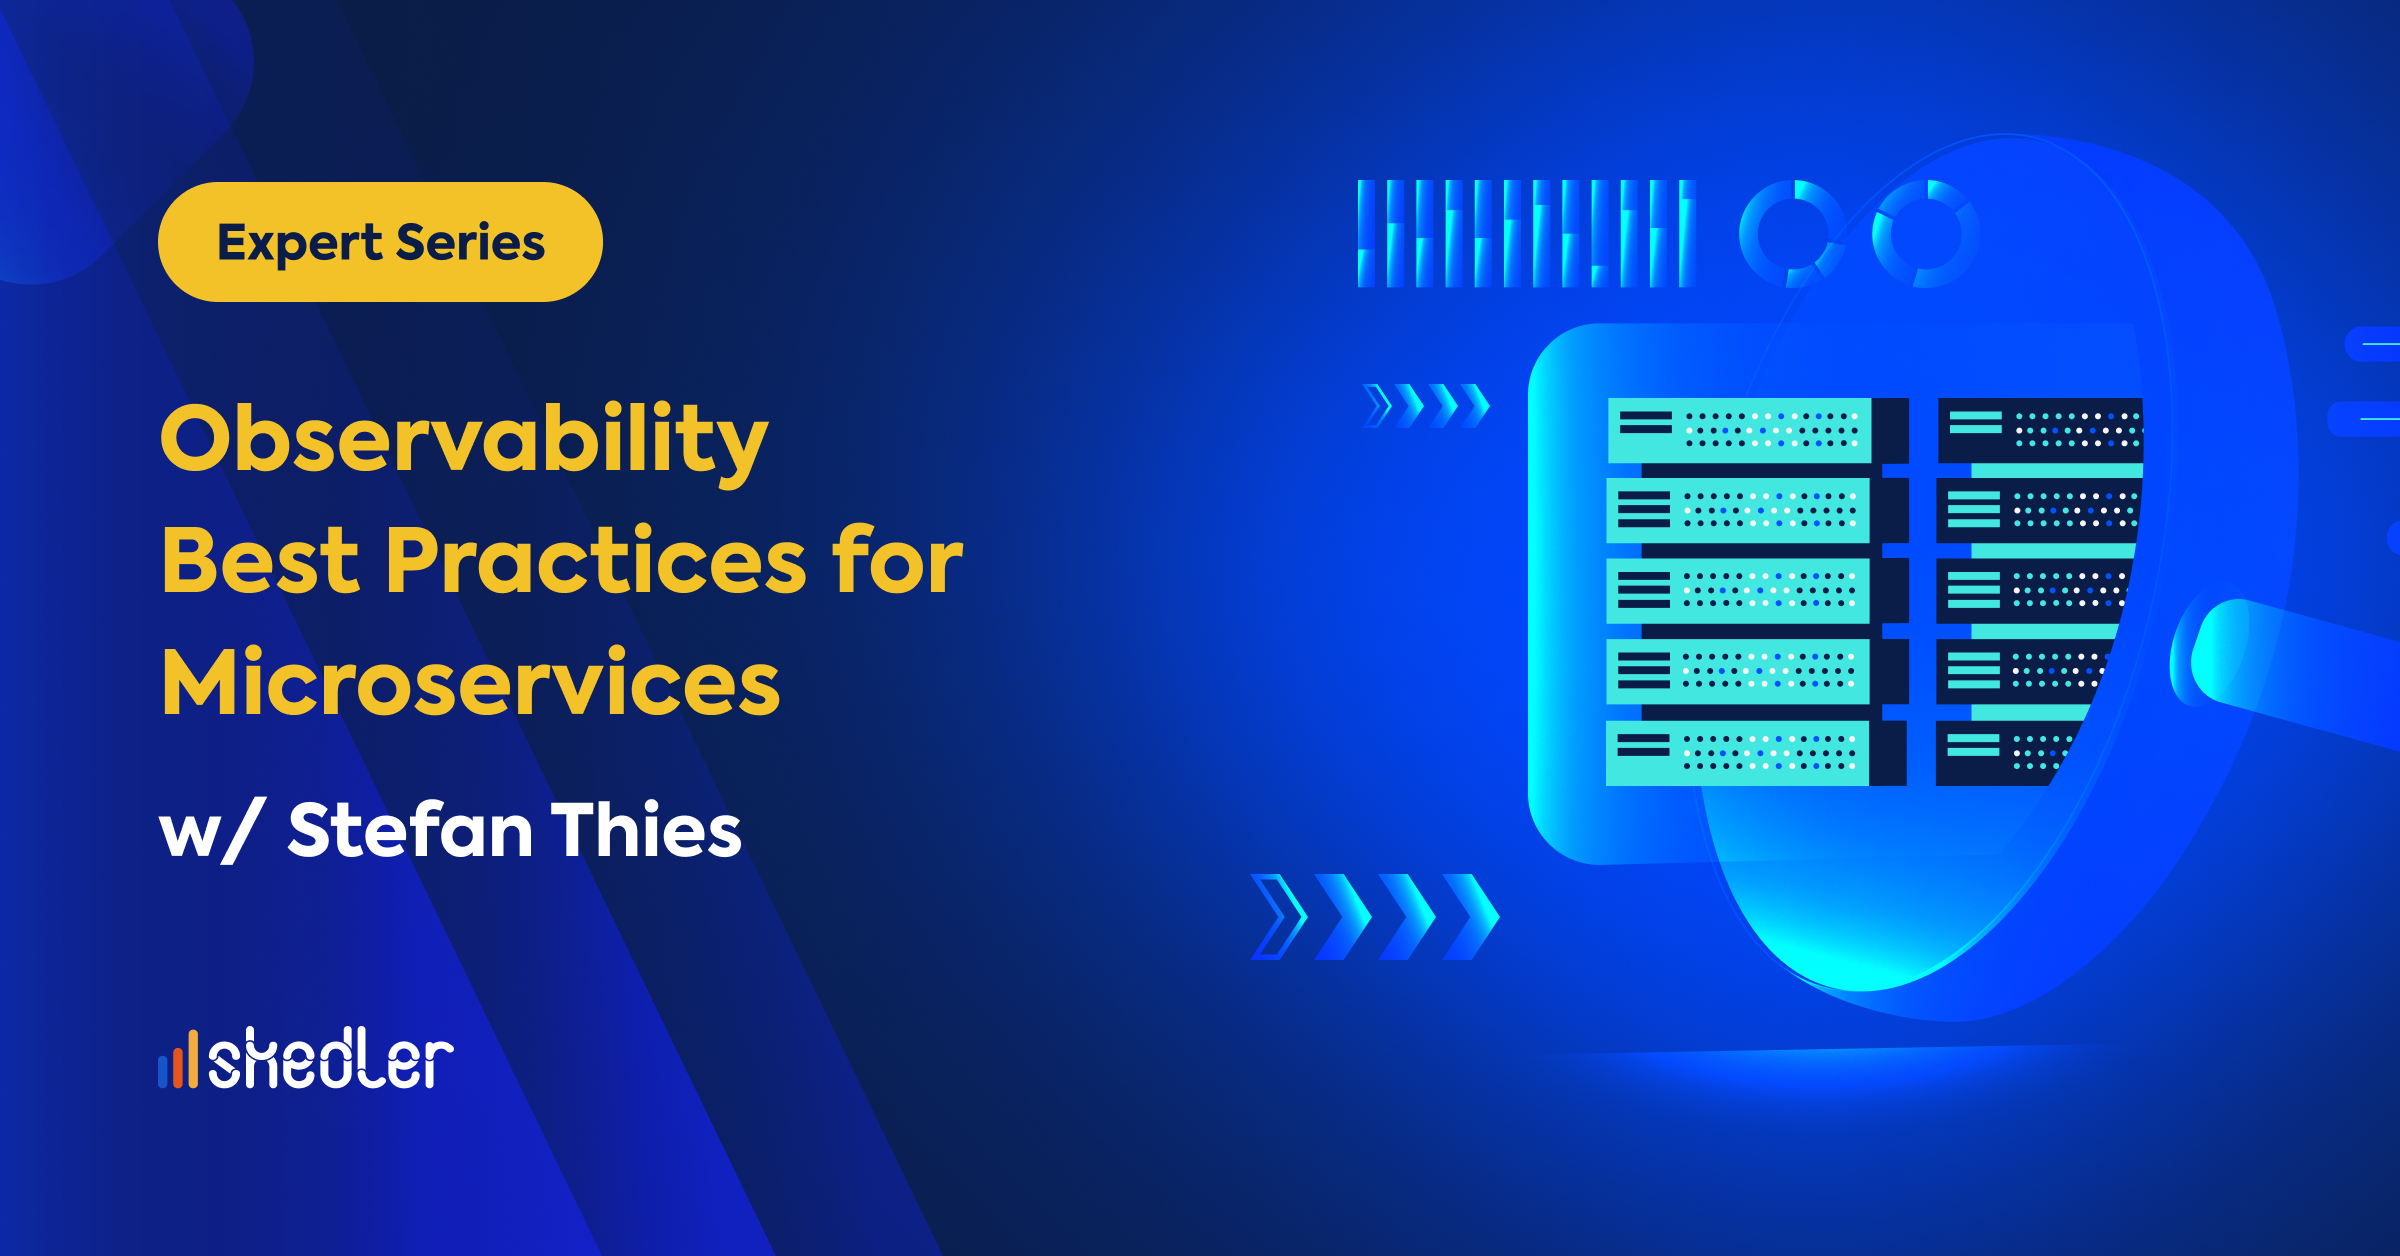
In this episode of Infralytics, Shankar interviewed Stefan Thies, the DevOps Evangelist at Sematext, a provider of infrastructure and application performance monitoring and log management solutions including consulting services for Elastic Stack and Solr. Stefan also has extensive experience as a product manager and pre-sales engineer in the Telecom domain. Here are some of the key discussion points from our interview with Stefan on implementing observability in microservices!
Microservices based on containers have become widely popular as the platform for deployingsolutions in public, private or hybrid clouds. What are the top monitoring and management challenges faced by organizations deploying container based microservices that want to implement observability?
There are quite a lot of challenges. Some people start simply with a simple host and later use orchestration tools like Kubernetes and what we see is that containers add another infrastructure layer and a new kind of resource management. At the same time we are monitoring performance with a new kind of metrics. What we developed in the past was special monitoring agents to collect these new kinds of metrics on all layers, so we have a cluster node with performance metrics for the specific node, on top of Kubernetes ports and in the port you want several containers and multiple processes, and first, new monitoring agents need to be container aware so they have to collect metrics from all of the layers.
The second challenge is the new way of dynamic deployment and orchestration. You deal with more objects than just servers and your services, because you also deal with cluster nodes, containers, deployment status of your containers. This can be very dynamic and orchestrators like Kubernetes move your applications around so maybe an application fails on one node and then the cluster shifts the application to another node. It’s very hard to track errors and failures in your application. So the new orchestration tools add additional challenges for DevOps people, because they need to see not only what happens on the applications but at the cluster level. Additional challenges are also added because things are moving around. There is now another layer of complexity added to the process.
What are additional challenges that come with containers? What should administrators be looking for?
There are metrics on every layer; servers, clusters, ports, containers, deployment status. Also another challenge is that lock management has also changed completely. You need a logging agent that’s able to collect the container logs. With every logline we add information on which node it is on, in which port it is deployed, and which container and container image, so we have better visibility. The next thing that comes with container deployment is microservices. Typically architectures today are more distributed and split into little services that work closely together, but it’s harder to trace transactions that go through multiple services. Transaction tracing is a new pillar of the observability but it requires more work to implement the necessary code.
Basically, log management becomes a challenge because of all of these microservices and you are also doing the tracing not just on the metrics and events, but you are also now looking at all of the trace files. So having more data requires people to have larger data stores.
How do you consolidate the different datasets?
We use monitoring agents and logagents. Both tools use the same tags so the logs and metrics can be correlated.
How do you standardize the different standards and practices?
With open source, it’s a lot of do-it-yourself which means you need to sit down and think what metrics do I have, what labels do I need, and do the same for the logging and for the monitoring.
What are your recommended strategies for organizations?
More and more users are used to having 24/7 services because they are used to getting that from Google and Facebook. All the big vendors offer 24/7 services. Smaller software vendors really have a challenge to be on the same level to be aware of any problem as soon as possible.
What you need to do is to first start monitoring; availability monitoring, then add metrics to it for infrastructure monitoring. Are your servers healthy? Are all the processes running? Then the next level is education monitoring to check the performance of your databases, your message queues, and the other tools you use in your stack, and finally the performance of your own applications.
When it comes to troubleshooting and you recognize some service is not performing well, then you need the logs. In the initial stage typically people use SSH, log into the server, try to find the log file, and look for errors. You need to collect the logs from all your servers, from all of your processes, and from all of your containers. Index the data and make it searchable and accessible. If you want to be really advanced you go to the level of code implementation and tracing.
What is observability? How is it different from monitoring?
Observability is the whole process. Monitoring, you have metrics, you have logs, and transaction tracing to have code level visibility. This process allows you to pinpoint where exactly the failure happens so it’s easier to fix it. When you have more information, it’s much faster to solve the problem.
How would an organization move from just monitoring to observability?
At Sematext our log management is very well accepted so people typically start with collecting the logs because it’s the first challenge they have; Where do I store all these logs? Should I set up a seperate server for it, or do I go for Software as a Service? These are the types of questions people are asking, so we see that people start collecting logs and then they start to discover more features and that we offer monitoring and then they start installing monitoring agents and they start to ask about specific applications. Automatically they start to do more and more steps. That is the process that our customers normally follow.
Are you interested in learning more about what Stefan’s company offers? Go to www.sematext.com. Are you looking for an easy-to-use system for data monitoring that provides you with automated delivery of metrics and provides code-free and easy to manage Alerts? Check out Skedler!
If you want to learn more tips from experts like Stefan, you can read more articles about the Infralytics video podcast on our blog!