February 17th, 2022
Three Pillars of Observability – Traces ( Part 3)
Introduction
The ability to measure a system’s internal state is observability. It helps us understand what’s happening within the system by looking at specific outputs or data points. It is essential, especially when considering complex, distributed systems that power many apps and services today. Its benefits are better workflow, improved visibility, faster debugs and fixes, and agility.
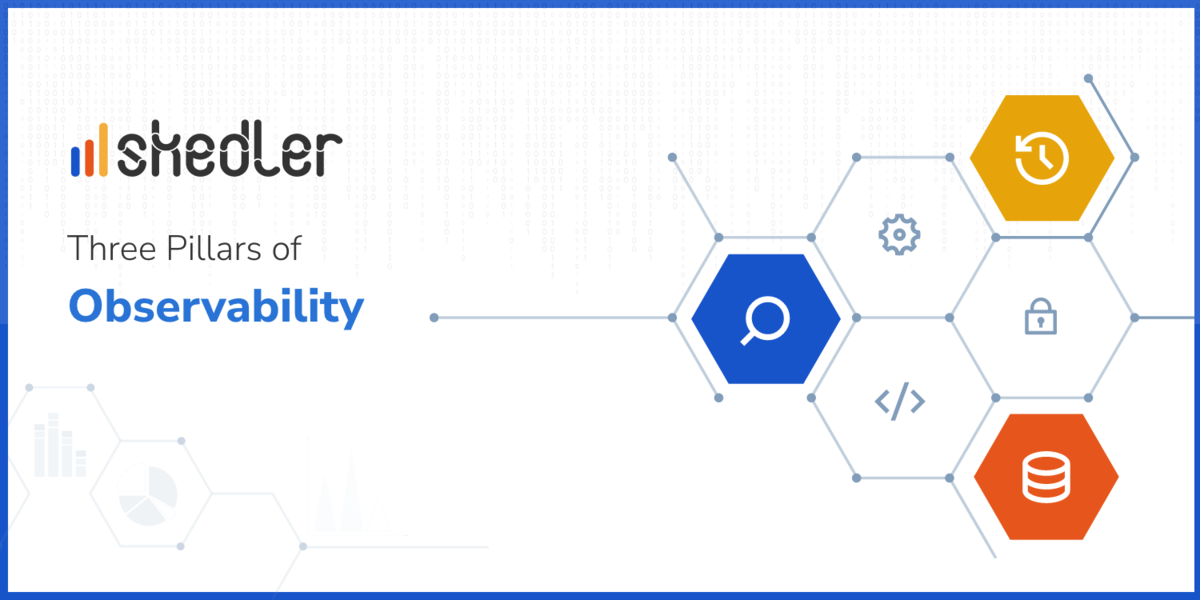
Observability depends on three pillars: logs, metrics, and traces. Hence, the term also refers to multiple tools, processes, and technologies that make it possible. We have already touched upon logs and metrics, and this article will cover the last pillar, traces.
Understanding Traces
The word ‘Trace’ refers to discovery by investigation or to finding a source, for example, tracing the origin of a call. Here too, the term refers to something similar. It is the ability to track user requests fully through a complex system. It differs from a log. A log may only tell us something went wrong at a certain point. However, a trace goes back through all the steps to track the exact instance of error or exception.
It is more granular than a log and a great tool to understand and sorting bottlenecks in a distributed system. Traces are ‘spans’ that track user activity through a distributed system (microservices). It does this with the help of a unique universal identifier that travels with the data to keep track of it.
Multiple spans form a trace that can be represented pictorially as a graph. One of the most common frameworks used for Traces is OpenTelemetry, created from OpenCensus and OpenTracing.

Why do we need to use Traces?
Traces help us correct failures provided we are using the right tools. Tracks are life-savers for admin and DevOps teams responsible for monitoring and maintaining a system. They can understand the path the user request takes to see where the bottlenecks happened and why to decide what corrective actions need to be taken.
While metrics and logs provide adequate information, traces go a step better to give us context to better understand and utilize these pillars.
Traces provide crucial visibility to the information that makes it more decipherable.
They are better suited for debugging complex systems and answering many essential questions related to their health. For example, to identify which logs are relevant, which metrics are most valuable, which services need to be optimized, and so on.
Software tracing has been around for quite some time. However, distributed tracing is the buzzword in the IT industry these days. It works across complex systems that span over Cloud-based environments that provide microservices.
Therefore, we cannot pick one over the other from the three observability pillars. Traces work well along with metrics and logs, providing much-needed overall efficiency. That is what observability is all about, to keep our systems running smoothly and efficiently.
Limitations
Implementing traces in systems is a complex and tedious task, especially considering most are distributed. It might involve codes across many places, which could be challenging for DevOps personnel. Every piece of data in a user request must be traced through and through. Implementing it across multiple frameworks, languages, etc., makes the task more challenging.
Also, tracing can be an issue if you have many third-party apps as part of your distributed system. However, proper planning, usage of compatible tools that support custom traces, monitoring the right metrics, etc., can go a long way in overcoming these.
The Skedler advantage
As we have already seen, if we have to make good use of the three pillars of observability, we need to rely on some good tools. We need a reliable reporting tool if we need good visualization from traces based on the information it has access to. That’s where Skedler comes in.
Skedler works with many components in the DevOps ecosystem, such as the ELK stack and Grafana, making it easier to achieve observability. The Skedler 5.7.2 release supports distributed tracing, the need of the hour. It performs with a new panel editor and a unified data model.
Skedler gives an edge by leveraging the best from the underlying tools to provide you with incredible visualized outputs. These reports help you make sense of the multitude of logs, metrics, traces, and more. They give you enriched insights into your system to keep you ahead. Thus, it helps ensure a stable, high-availability system that renders a great customer experience.
Conclusion
In conclusion, we could say that observability is a key aspect of maintaining distributed systems. Keeping track of the three pillars of observability is critical – logs, metrics, and traces. Together, they form the pivotal backbone of a healthy system and a crucial monitoring technique for all system stakeholders.
While multiple tools are available for this purpose, a crucial one would be to provide you with unmissable clarity on the system’s health. A good observability tool should generate, process, and output telemetry data with a sound storage system that enables fast retrieval and long-term retention. Using Skedler can help you deliver automated periodic visualized reports to distributed stakeholders prompting them to take necessary action.