The Best Grafana Reporting Tools for 2024
Grafana Reporting Breaks Down Information Silo
Information silos are detrimental to collaboration and organizational efficiency. While Grafana dashboards provide real-time data access to analysts and engineers, they often present a barrier for non-technical users, operations teams, and stakeholders who must log in or engage with terminal interfaces. To truly democratize the information captured in your Grafana platform, you need to break down the information silo created by Grafana dashboards.
(Source: Waldemar / unsplash)
Grafana Reporting is your hammer for breaking down the information silos created by Grafana. With Grafana Reporting, you can liberate data that’s traditionally locked within dashboards, extending its reach to a broader audience that includes operations teams, field personnel, stakeholders, and customers who may not have direct access to the Grafana platform or prefer not to navigate Grafana dashboards.
Grafana Reporting empowers you to extract vital metrics and trends from your dashboards and seamlessly share them with stakeholders who rely on data-driven insights for their day-to-day operational decisions. In the following sections, we will delve deeper into Grafana Reporting and explore the top three Grafana Reporting tools available in 2024.
What is Grafana Reporting?
Grafana Reporting is the process of creating and automating the generation and distribution of PDF, XLS, CSV, HTML reports from Grafana dashboards. Reports are created by reusing the existing visualizations and data queries in Grafana dashboards without having to recreate them from scratch.
Grafana Reporting offers the flexibility to schedule report generation at your preferred frequency, whether it’s daily, weekly, or monthly. This automation extends to the seamless distribution of reports to your stakeholders through notification channels like email and Slack.
(Source: Scott Graham / unsplash)
Grafana Reporting is an excellent type of Information Radiator, especially for remote working teams and customers. Much like the traditional Big Visible Charts used in physical office settings, Grafana Reporting takes the role of radiating vital information to team members spread across different locations via channels such as email and Slack. This innovative approach fosters increased collaboration, transparency, and accountability, while simultaneously elevating operational efficiency and enhancing visibility into critical metrics and trends.
What is the Purpose of Grafana Reporting?
Grafana Reporting is typically implemented by organizations that have set up dashboards in Grafana and are now looking to distribute the dashboard information to users who are managers, customers, or operations teams who do not have access to the dashboards or are often too busy to be sitting in front of dashboards.
(Source: Campaign Creators / unsplash)
Grafana Reporting has become a vital tool since a vast majority of the users in any organization do not have continuous access to Grafana dashboards. It is therefore used by businesses of all sizes to distribute Grafana information to stakeholders both internally within their companies and externally to their clients. By delivering the right information at the right time to the right users, Grafana Reporting helps users (recipients) make informed decisions and better manage their business operations.
Popular Use Cases for the Use of Grafana Reporting
- Infrastructure Operations: Reports on infrastructure availability and performance monitoring metrics are automatically generated and distributed to operations teams and managers.
- Network Operations: Companies such as Enghouse use Grafana Reporting to distribute daily and weekly hotspot reports to field service engineers and managers so that they can prioritize and resolve high-value network issues.
- Factory Production Operations: Industries such as steel, lumber, and semiconductors find immense value in Grafana Reporting for operational monitoring and reporting.
What Makes an Effective Grafana Reporting Tool?
An effective Grafana Reporting tool is not defined by a multitude of features but rather by its ability to fulfill a core set of requirements. These requirements have been carefully curated based on years of experience working alongside Grafana users.

The core requirements for a Grafana Reporting Tool are:
Functional Requirements
- Custom Layouts: Users should have the capability to tailor PDF report layouts, ensuring that data is presented in an easily comprehensible manner.
- Templates: Branded report templates play a pivotal role in demonstrating the value of your data and services to customers and key stakeholders.
- Grafana Variables: The tool should facilitate the use of Grafana variables, enabling the generation of personalized reports from a single Grafana dashboard for various teams.
- Flexibility: Users should be able to organize data in a layout that is readily understandable for recipients. Additionally, the tool should provide flexible scheduling and automation for report distribution across multiple notification channels, such as specific dates or days of the week.
- SLA & Error Notifications: To maintain service level agreements (SLAs) when sending reports to managers or customers, the tool should notify users of any issues with specific reports.
Technical Requirements
- Scalability: The Grafana Reporting Tool must be robust enough to generate reports from large Grafana dashboards with several visualizations, ensuring it remains stable even with heavy data loads.
- Support & Upgrades: Ongoing maintenance, enhancement, and support are crucial for keeping the tool aligned with Grafana updates, allowing teams to seamlessly transition to the latest Grafana versions.
- Performance: The tool should be capable of exporting data swiftly and efficiently, enhancing user experience.
In addition to these core requirements, factors such as cost and budget considerations are often critical when selecting the most suitable Grafana Reporting tool. Organizations using multiple dashboard tools, such as Kibana or various instances of Grafana/Kibana, may require a unified reporting solution.
Now that we have discussed the key requirements for a Grafana Reporting tool, the next question is:
Can Grafana Generate Reports?
The answer is no. Grafana is a dashboard tool and does not generate reports. The open-source Grafana, by default, does not offer reporting functionality.
It’s only with the proprietary Grafana Enterprise Stack, a paid version, that you gain access to reporting features. Now, let’s explore your alternatives for achieving Grafana reporting.
The 2 Best Tools for Grafana Reporting in 2024
For professionals in operational engineering or management roles who have implemented Grafana to monitor critical operational metrics, the demand for report delivery via email or Slack is a common and essential requirement. The ability to provide such reports is vital to ensuring stakeholders stay informed and updated.
Luckily, you have two compelling options at your disposal to address this imperative need:
- Grafana Enterprise Stack
- Skedler Reports
Before we delve into a detailed exploration of these two solutions, let’s begin by addressing a key question that may be on your mind
Are there any free or open-source Grafana Reporting tools?
Unfortunately, there are no actively maintained free or open-source Grafana Reporting tools. The main issue is that any open-source reporting project needs to keep pace with the rapid and frequent updates to Grafana. When you upgrade to the latest version of Grafana, your reporting setup will break down if the tool fails to keep pace with the new releases of Grafana.
(Source: Tim van der Kuip / unsplash)
Grafana Reporting Tool vs Skedler: Which is the more budget-friendly option?
When it comes to automating your reports, Skedler stands out as a cost-effective option compared to Grafana. While both solutions offer robust reporting tools, Skedler provides a more budget-friendly choice for organizations seeking an efficient way to automate their reporting processes. If you want to know more about Skedler’s price, get a quote!
A Deep Dive into the 2 Grafana Reporting Tools
Grafana Enterprise Stack
Grafana Enterprise Stack is a proprietary offering from Grafana that includes a number of enterprise plugins, collaboration features, reporting, enhanced LDAP, enterprise support, and services.
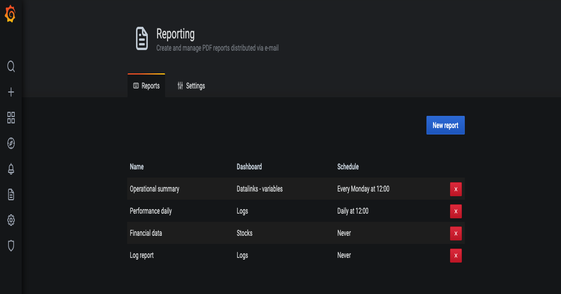
Reporting is a feature of Grafana Enterprise Stack. According to the Grafana Enterprise website, two distinct capabilities of reporting are available in the Enterprise Stack.
- Automatically generate PDFs from any dashboards and have it emailed to interested parties on a schedule
- Generate PDFs from any of your dashboards and save it to file
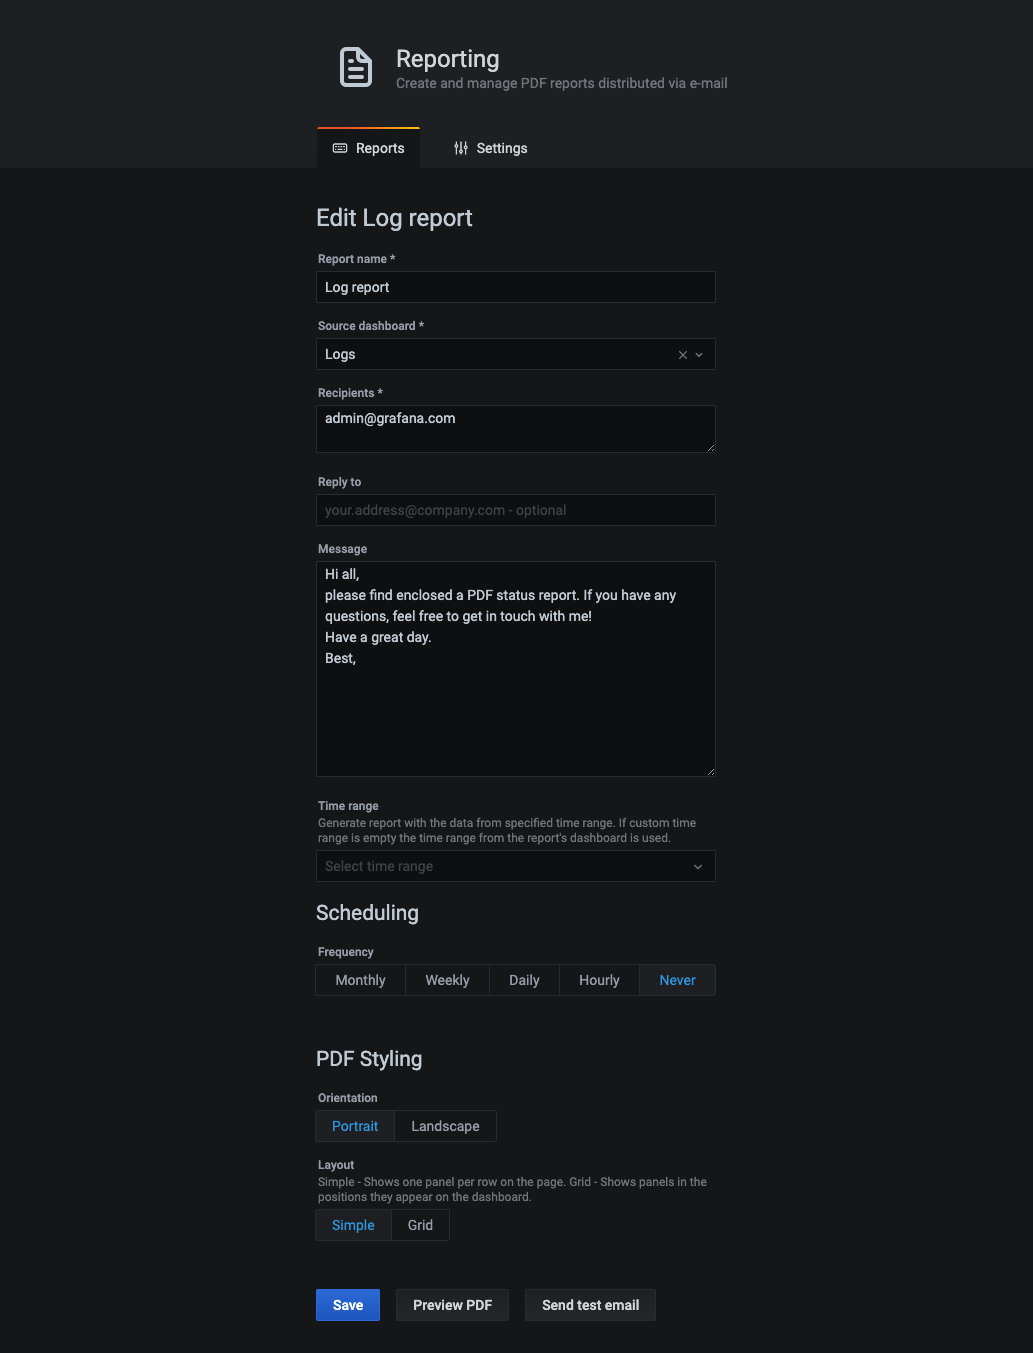
Reporting in Grafana Enterprise Stack includes the following features:
- Create and update PDF reports
- You can customize reports in 4 different types of layouts
- Simple – Portrait: Portrait style PDF with 3 panels per page
- Simple – Landscape: Landscape style PDF with 1 panel per page
- Grid – Portrait: All the dashboard panels are laid out with a similar layout in a single Portrait style PDF page
- Grid – Landscape: All the dashboard panels are laid out with a similar layout in a single Landscape style PDF page
- Schedule reports to be emailed out on an hourly, daily, and monthly basis. You can also choose to save the reports to file and not email them.
- Time range can be customized for the reports
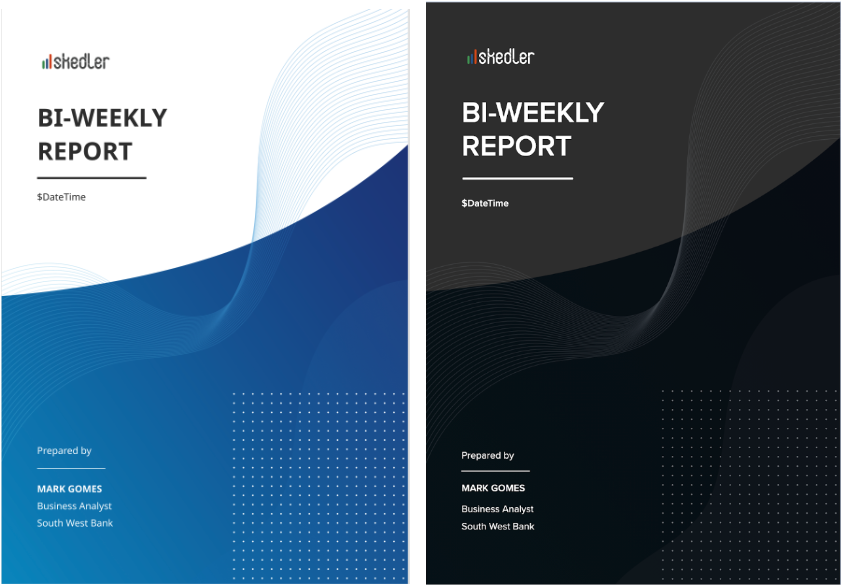
- Reports can be branded with the company logo, email footer, footer text, and url.
- You can use API to generate or pause reports
- Scheduling of reports is limited to administrators.
Let’s look at the pros and cons of the reporting capability in Grafana Enterprise:
The Advantages of Reporting in Grafana Enterprise Stack
- Included with Grafana Enterprise. It is easy to install and set up
- It serves the purpose of sending out dashboards
- It provides basic customization, scheduling, branding capabilities
- It keeps pace with the latest versions of Grafana.
The Disadvantages of Reporting in Grafana Enterprise Stack
Although Grafana Enterprise Stack offers several notable advantages, it is important to be aware of its limitations:
- Report layouts are limited to four predefined types, which prevents you from creating custom layouts for different panels.
- Custom branded reports are not supported, which means that only a standard report with a consistent logo and footer can be created.
- The notification system is limited to the SMTP email channel.
- Excel reports are not within the tool’s capabilities.
- The tool lacks burst reporting functionality, which means that multiple individualized reports cannot be generated for multiple recipients from a single dashboard within a single report definition.
- Scheduling capabilities are basic and do not include features such as scheduling reports for specific business days or annual reports.
- Unfortunately, the tool lacks error management, leaving users with no means to quickly address root causes if report generation fails.
- Last but certainly not least, you’ll need to acquire a Grafana Enterprise Stack license to access reporting. While Grafana’s pricing is customized based on your specific needs, Skedler is a more cost-effective tool if you’re looking to automate your reports.
Summary of Grafana Enterprise Stack Reporting
Grafana Enterprise Stack Reporting is a good option for your Grafana reporting needs if the following criteria apply to you:
- You have a need for the other features in Grafana Enterprise Reporting so you are ok to spend $3,500 or more per month.
- You just need a simple reporting option to send out the dashboards as-is to a limited number of internal users. The users do not require any customization of reports.
- You do not need any Excel reporting
- You do not have a need for any of the features mentioned in the previous section.
Skedler Reports for Grafana
Skedler Reports is an enterprise reporting automation tool for Grafana and Elasticsearch-Kibana. It was originally developed to provide a reporting option to Elastic Stack. When customers started asking for Grafana support, the Skedler team added Grafana Reporting to its offering. Skedler was the first reporting tool developed for Elastic Stack and Grafana and is widely used by Grafana users.
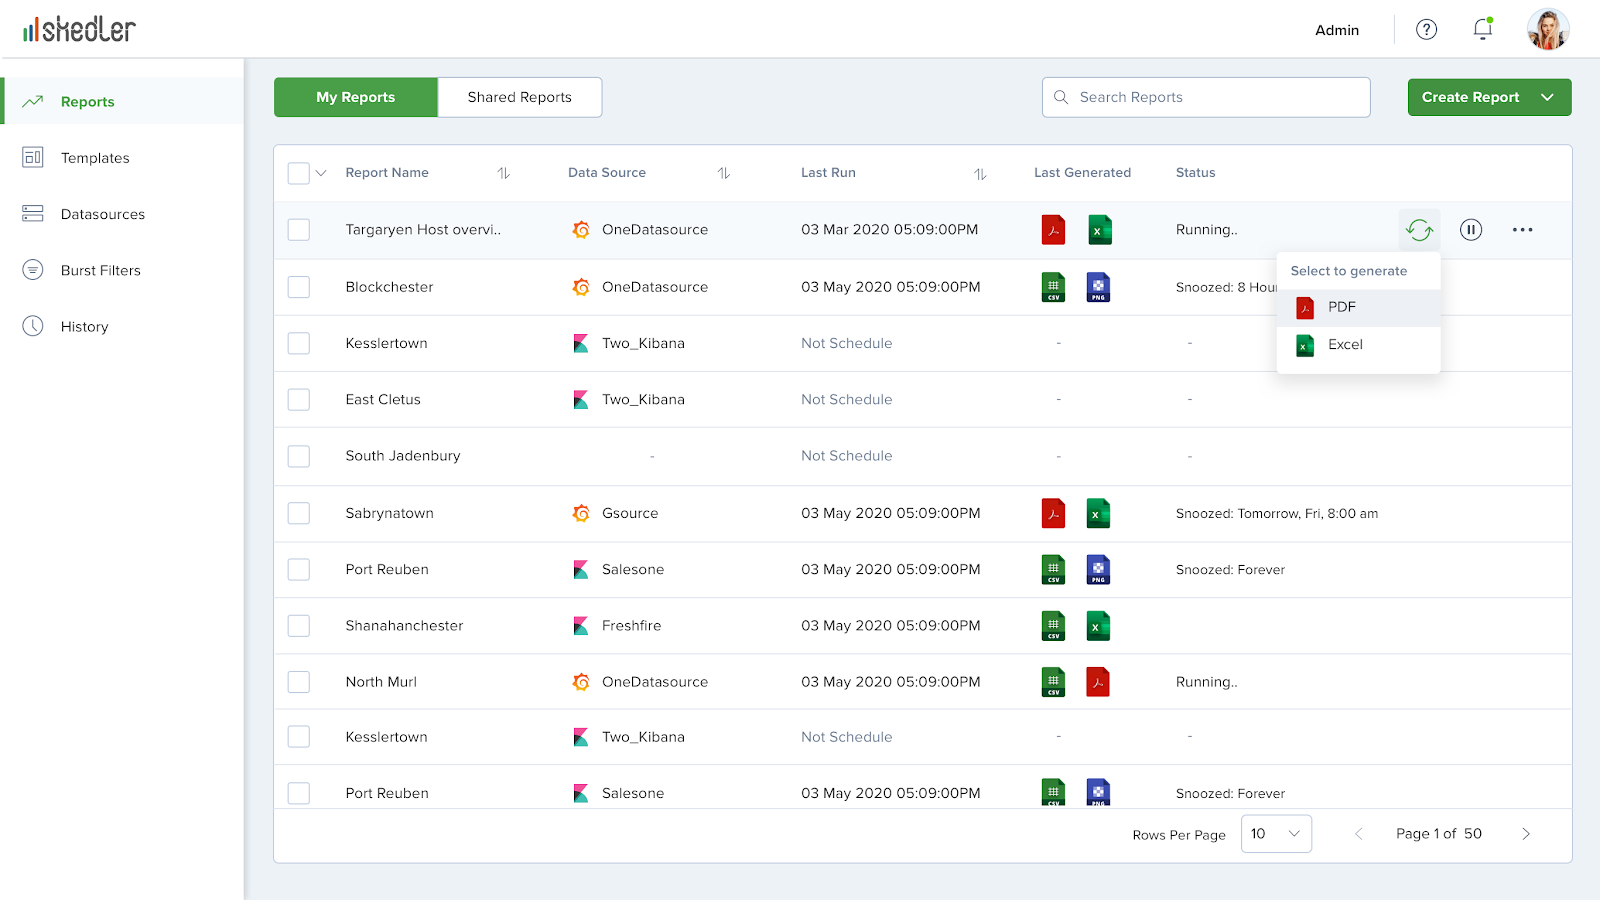
Skedler Reports offers the following capabilities:
- Create and update PDF, Excel, CSV, and HTML reports from Grafana dashboard panels
- Download, save, and schedule the automatic distribution of reports via email or slack channels
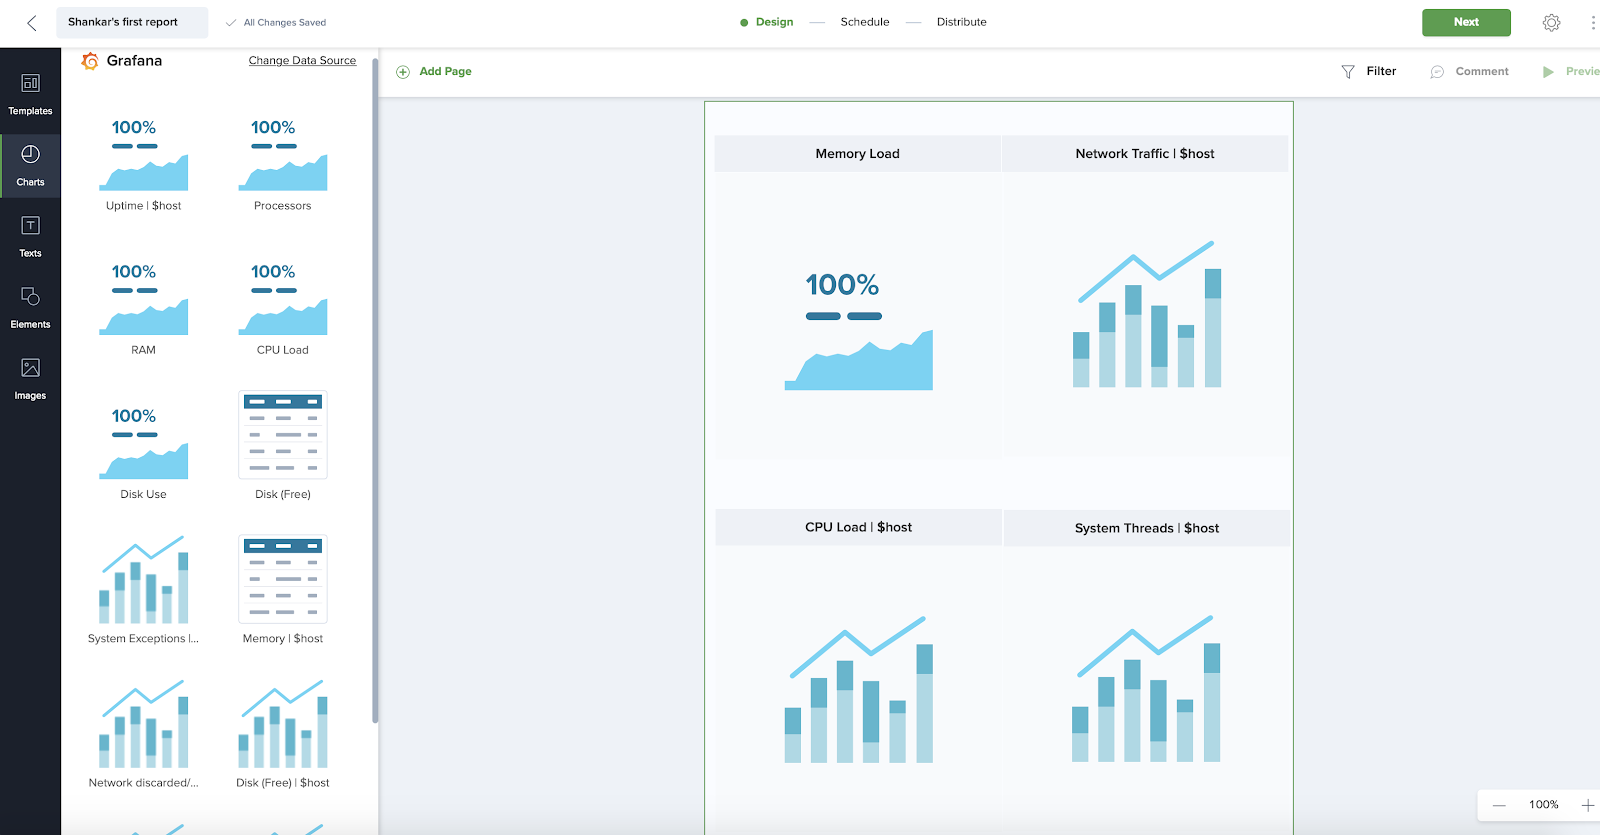
- Customize PDF reports with flexible layouts, smart layouts, and dashboard layout
- Personalize reports to recipients by using burst reporting.
- Pause/resume of schedules
- View the history of generated reports
- Error handling to inform administrators when attention is needed.
- Compatible with the latest versions of Grafana. New versions are released within 2-4 weeks of the Grafana update. Continuous support since the early versions of ELK and Grafana
- It’s a no-code, UI-driven solution.
Now, let’s look at the pros and cons of the Skedler Reports for Grafana:
The Advantages of Skedler Reports for Grafana
- Quick to install and configure
- Works with older and latest versions of Grafana
- Support for not just PDFs but also Excel/CSV/HTML reports
- Layouts can be customized with rich templates to drive the value of data.
- Templates can be used to project branding
- You can send personalized reports to different recipients from a single dashboard
- Flexibility in scheduling and distribution
- Multiple deployment options such as docker
- Works with Grafana On-Prem and Grafana Cloud
- Can be used by both administrators and end users
- Robust error handling and notification mechanisms
The Limitations of Skedler Reports for Grafana
- At this time, Skedler is not available as a plugin inside Grafana. Skedler is deployed as a standalone application that can be used for reporting from one or more Grafana or Elasticsearch-Kibana instances.
- Requires a separate installation in addition to the Grafana.
- The cloud option is not available until Q3 2024.
Why You Should Consider Skedler Reports for Grafana
Skedler Reports for Grafana offers a compelling choice for your reporting requirements if you meet the following criteria:
- Your focus is exclusively on Grafana Reporting, without the need for the advanced features found in Grafana Enterprise Stack.
- You seek a powerful reporting solution that provides customization options and adaptability to meet your unique needs.
- Cost-efficiency is a priority, and you require a solution that aligns with your budget.
- You value having access to support to address your needs and concerns effectively.
Need an Awesome Grafana Reporting Solution?

Skedler is Grafana’s best reporting automation tool. If you haven’t tried it yet, we invite you to do so and give us your feedback on how to improve our tool.
Unlock the power to break down data barriers, distribute reports effortlessly to your stakeholders and save time and effort by automating your reports. We offer a 15-day free trial so you can experience the benefits of automating your reporting with Skedler. We also invite you to follow us on Twitter, LinkedIn and Facebook.
