March 15th, 2024
Optimizing Grafana Dashboards: Mastering Filters with Skedler
In data visualization and analysis, filters play a crucial role in tailoring reports to specific requirements. Unlock the full potential of your Grafana dashboard with advanced filtering using Skedler. Filters are not just a feature; they are your gateway to custom reports that provide insights into specific aspects of your data.
Grafana, a robust open-source platform initially conceived to visualize time-series data, has since grown into a thriving community with more than 20 million users worldwide. It has become the go-to tool for creating interactive and customizable dashboards that allow users to extract meaningful information from their data. In this article we explain more about Grafana filters so you can take your reports to the next level.
Understanding Filters: A Use Case Scenario
Use Case: Geo-based Issue Aggregation
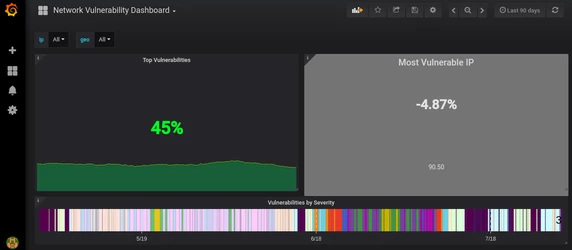
- Top Vulnerabilities
Explore the percentage of common issues reported by IP addresses from different Geo destinations. Gain a holistic view of the data to make informed decisions.
- Most Vulnerable IP
Identify the IP addresses with the highest percentage of reported issues. Pinpoint vulnerabilities and address them strategically.
- Vulnerabilities by Severity
Categorize and analyze issues based on severity assigned by the vulnerability scanner. Prioritize actions for a more secure environment.
- Notification via Email
Implement automated notifications to stay informed about critical issues, ensuring a proactive response.
How Filters Work in Grafana
Gain control over your dashboard metrics by creating template variables for the dashboard.
Grafana users usually enhance the functionality of their dashboards by incorporating template variables, which are employed in metric queries and panel titles. By adjusting the variable values via a convenient drop-down menu, users can dynamically alter the metric queries reflected in their panels.
To precisely isolate issues based on IP address and Geo Destination, users can establish filters within Skedler, seamlessly integrating with the Grafana dashboard.
Adding Filters to Your Reports with Skedler: A Step-by-Step Guide
If you are using Skedler and want to incorporate filters into your reports, don’t miss this complete video tutorial we have prepared for you.
This will guide you to create your filters in just a few minutes and take your reporting to the next level. If you haven’t tried Skedler yet, you can download our free trial.
The importance of filters in data visualization
Filters play a key role in data visualization, as they offer a strategic advantage when interpreting and presenting information. They allow users to focus on specific subsets of data, providing clarity and relevance. Filters are especially important in the following situations:
- Data complexity: Dealing with large data sets is made manageable by isolating specific parameters for analysis.
- User customization: Filters allow users to tailor reports to their specific needs, fostering a personalized analytical experience.
- Dynamic analysis: Filters facilitate dynamic adjustments of displayed data, enhancing real-time decision-making processes.
In short, filters are indispensable tools that enable users to navigate the complexities of data visualization accurately and efficiently.
If you found this article interesting, we invite you to read our other Grafana articles, such as this one on why Skedler is the best alternative to Grafana reporting, or this one on the key differences between Grafana and Kibana.