April 24th, 2024
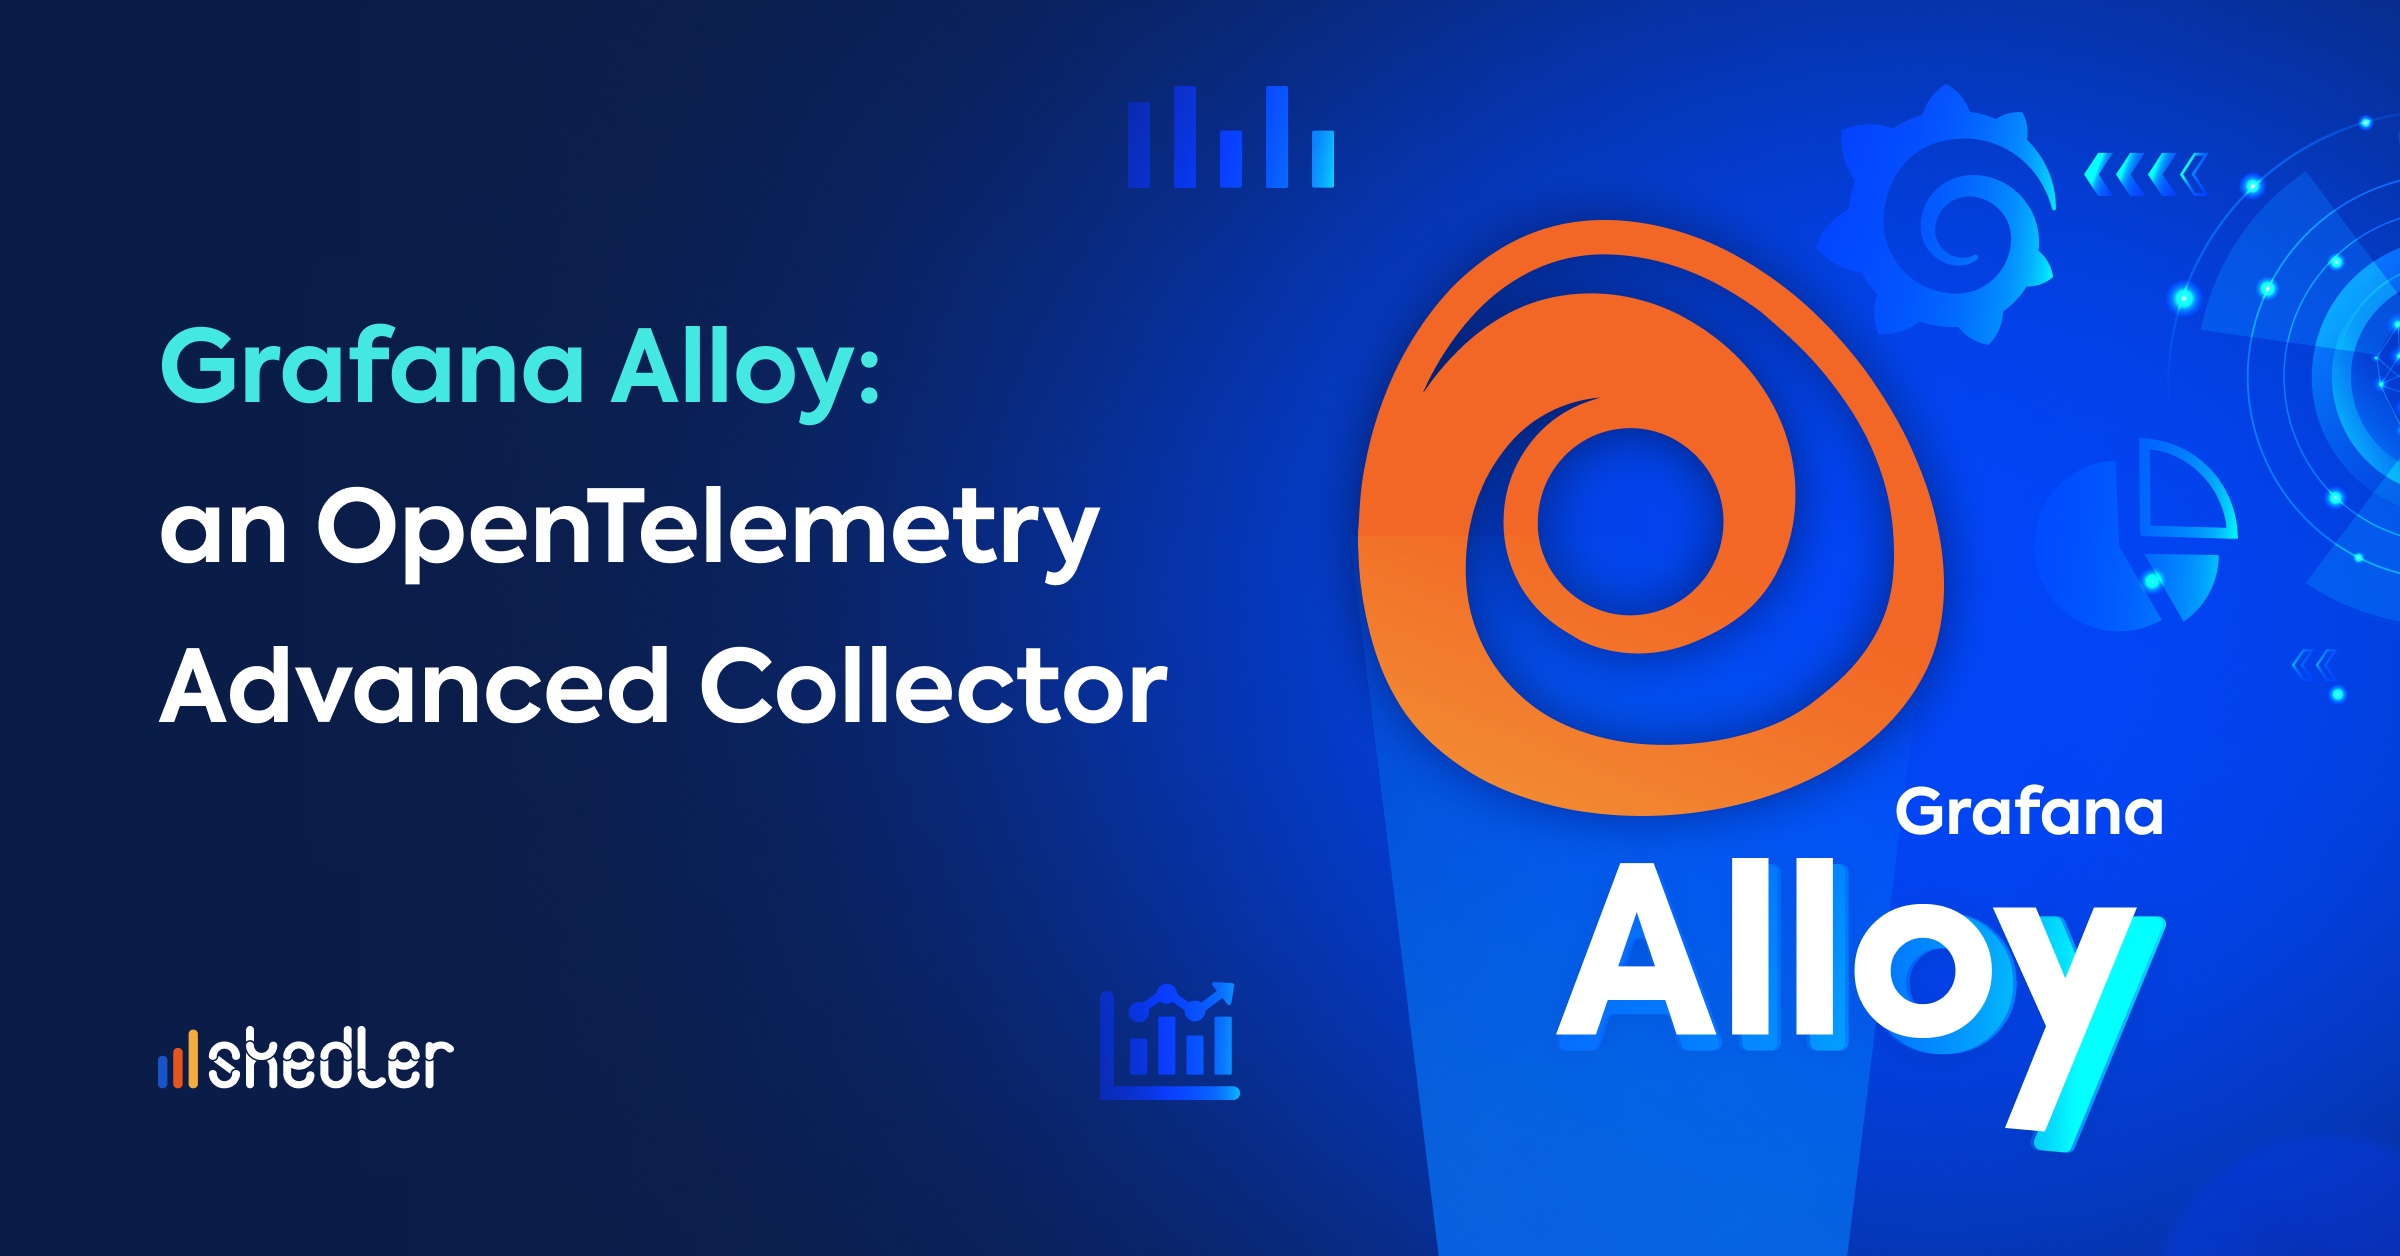
What is Grafana Alloy? The OpenTelemetry Advanced Collector | Learn more!
In April 2024 Grafana introduced Grafana Alloy. In this article we tell you everything you need to know about this telemetry collector. Keep reading!
What is Grafana Alloy?
Grafana Alloy emerged as the successor to the Grafana Agent, launched in 2020 to address the increased complexity and popularity of Prometheus. Initially providing a versatile and high-performance solution across various setups such as Grafana Cloud and on-premise systems, the Grafana Agent excelled in managing Prometheus data with minimal local storage needs.
With the proliferation of use cases, Grafana expanded its toolkit by introducing specialized agents like Promtail for Loki logs and the Grafana Agent Operator for Kubernetes environments. This variety, however, sometimes complicated the selection process for users. To streamline this, Grafana Alloy was created to consolidate the capabilities of these diverse agents into a single, cohesive platform. As an open-source distribution of the OpenTelemetry Collector that is fully OTLP-compatible, Alloy supports a broad array of telemetry formats, including metrics, logs, traces, and profiles, offering a unified and potent observability solution.
Grafana Alloy’s Role as an OpenTelemetry Collector
Introduced at GrafanaCON in 2024, Grafana Alloy is not just another collector; it represents Grafana Labs’ vision to create a comprehensive “big tent” collector. Compatible with leading open-source observability frameworks, Alloy includes advanced features for modern cloud-native environments, making it ideal for enterprise-scale operations.
Why Choose Grafana Alloy?
Configurability and Ingestion
Alloy excels in its ability to pull configurations from diverse sources like GitHub, S3, and HTTP endpoints. It natively ingests a wide range of telemetry data, ensuring compatibility with a variety of formats including Prometheus, OpenTelemetry, Mimir, Loki, Tempo, and Pyroscope. This capability enables SREs to deploy production-ready pipelines quickly and efficiently using Alloy modules.
High Availability and Security
Designed for high workload distribution, Alloy ensures reliability through built-in clustering features. It also enhances security by connecting to services like HashiCorp Vault for secure retrieval of secrets, thereby reducing the local management of sensitive information.
Debugging and Troubleshooting
Alloy simplifies problem-solving with an embedded debugging UI accessible via the Alloy HTTP server. This tool helps users identify and fix configuration issues swiftly, promoting a smoother operational flow.
How Does Grafana Alloy Work?
Collection
Alloy utilizes over 120 components to gather telemetry data from a multitude of sources including applications, databases, and other collectors. It supports both push and pull mechanisms for data acquisition, tailored to user preferences and system requirements.
Transformation
Once collected, the data undergoes transformation within Alloy. These transformations can include the injection of additional metadata or the filtering out of unnecessary data, depending on the operational needs.
Data Handling and Alerts
Finally, Alloy processes and sends the data to compatible databases or collectors like the Grafana LGTM stack or Grafana Cloud. It can also configure alerting rules within these databases to enhance monitoring and response strategies.
What is OpenTelemetry?
OpenTelemetry, also known as OTel, is an influential open-source observability framework that is reshaping how organizations monitor cloud-native applications and understand complex systems. At its core, OTel provides a unified collection of tools, APIs, and SDKs designed to systematically capture telemetry data—metrics, logs, and traces—from various sources. This data is crucial for analyzing and improving software performance and behavior.
Check out this Expert Series with Adnan Rahić, an expert in microservices observability who talked about the importance that OpenTelemetry will have in the future:
Understanding OpenTelemetry and Its Importance
Observability is not just a tool, but a feature of modern IT infrastructure, crucial for maintaining system reliability and efficiency. OpenTelemetry enhances observability by allowing developers and IT teams to understand the internal workings of their applications through external outputs. It acts as the backbone for monitoring applications and infrastructure by providing comprehensive insights into their performance and health.
The framework supports multiple programming languages and environments, making it incredibly versatile for integrating with existing systems. By standardizing how telemetry data is collected, OpenTelemetry eliminates inconsistencies that can complicate system monitoring efforts.
Benefits of Implementing OpenTelemetry
One of the major advantages of OpenTelemetry is its vendor-neutral approach. This means that it doesn’t lock developers into specific monitoring tools or platforms. Here are some highlighted benefits:
Standardization Across Platforms
OpenTelemetry standardizes the collection and transmission of telemetry data across different environments and platforms. This standardization helps avoid the data silos and integration headaches commonly associated with using multiple monitoring tools, providing a cohesive overview of system performance.
Ease of Integration
With SDKs and APIs available for various languages, OpenTelemetry simplifies the process of instrumenting applications. Developers can integrate telemetry capabilities without significant alterations to existing codebases, facilitating continuous and comprehensive observability.
Vendor Agnosticism
Being vendor-neutral, OpenTelemetry allows organizations to switch between different backend monitoring services without the need to re-instrument their applications. This flexibility can lead to cost savings and greater operational agility.
Future-Proofing
As new technologies and platforms emerge, OpenTelemetry’s open-source nature and active community support ensure that it evolves to support these innovations. Unlike proprietary solutions that may require vendor-specific updates, OpenTelemetry continuously adapts, providing long-term viability.
Community-Driven Improvements
The framework benefits from contributions by a vibrant community of developers and companies. This collective effort not only accelerates feature development and bug fixes but also ensures that OpenTelemetry meets the broad needs of its users.
Conclusion
As a successor to the Grafana Agent, Alloy enhances observability with its integration into the OpenTelemetry framework, supporting a range of data types and ensuring high availability and security for enterprise-scale operations. Just like Kubernetes revolutionized container management, Grafana Alloy is set to transform how organizations monitor their cloud-native applications.
There is no doubt that Grafana Alloy will bring significant benefits to its users. To discover how Grafana Alloy can enhance your observability strategy through OpenTelemetry, visit the official Grafana website for more information.
Skedler: Enhancing Grafana Reporting
If you’re using Grafana for data visualization, you have to try Skedler! Skedler is the best alternative to Grafana reporting. While Grafana excels at creating dynamic, real-time visualizations, its reporting features, although functional, can be somewhat limited in flexibility and depth. Skedler addresses these shortcomings by offering advanced customization options for reports, supporting a variety of formats including PDF, Excel, and HTML, and enabling sophisticated scheduling and distribution strategies.
Moreover, Skedler simplifies the reporting process with its user-friendly configuration and cost-effective pricing structure, making it an accessible choice for all sizes of organizations.
Start your free trial today!