June 9th, 2023
Prometheus vs Grafana: A Comparative Analysis
Prometheus vs. Grafana: discover their functionalities and features and how these two open source tools can work together in this article.
An Introduction to Grafana And Prometheus
Grafana is an open-source tool to analyze and visualize users’ data by creating dynamic and interactive dashboards. With Grafana, users can connect to a variety of data sources, including databases, cloud services, and even Internet of Things (IoT) devices. Initially, it was built to visualize time series data, but it has evolved to support a wide range of data sources. Also, it integrates seamlessly with other monitoring tools like Prometheus and Graphite. This allows users can combine and streamline data from several sources into unified dashboards and gives them an in-depth knowledge of their systems and applications. Read more in this article about everything you need to know about Grafana.
On the other hand, Prometheus is another open-source monitoring and alerting tool to collect and analyze time-series data. It offers essential insights into the health and performance of systems and is frequently utilized in current infrastructure and application monitoring. It also provides PromQL (Prometheus Query Language) to make complicated searches and aggregations on the collected metrics. This makes it possible to create unique dashboards and alerts, monitor particular indicators, and explore data flexibly.
Prometheus vs. Grafana: Feature Comparison
Data Collection and Storage
Prometheus uses a pull-based system for data collection, and it serves as a central server that periodically scrapes metrics from different targets like applications, services, or systems. These targets expose their metrics through an HTTP endpoint. This tool also offers a collection of exporters and libraries that make it simple to instrument applications and systems and enable developers to expose custom metrics.
This tool can also scrape these metrics for further analysis and visualization. Prometheus has an in-built time series database to store all the collected metrics from the different targets. The database is optimized for high-performance time-series data handling, allowing efficient querying and retrieval of historical data. On the other hand, Grafana does not have its storage and system for data collection since it is mainly focused on data visualization and monitoring. So it expects users to set up a data source such as MySQL, Influx, Elastic Search, and Prometheus.
Querying
Prometheus provides a powerful query language specifically designed for time series data called PromQL (Prometheus Query Language). It allows users to make complicated searches and aggregations on the metrics collected by Prometheus. PromQL also offers instant queries, range queries, and subqueries and enables users to retrieve data over a range of time intervals.
Grafana provides various querying tools that enable users to retrieve data from numerous databases and sources. It also supports well-known query languages such as InfluxQL, Graphite Query Language (GQL), and Elasticsearch Query DSL. Additionally, Grafana offers a query builder interface that makes it easier for users unfamiliar with query languages to construct queries graphically. This flexibility enables users to work seamlessly with different data sources within Grafana.
Alerting
One of Prometheus’ key features is its effective alerting system. PromQL allows users to create alert rules based on particular criteria or thresholds. By default, Prometheus does not support functionality to the necessary channels. Prometheus expects Alertmanager to be installed on its server to send alerts to a variety of notification channels, including email, Slack, and PagerDuty, when criteria or thresholds are satisfied. On the other hand, Grafana provides a complete and robust alerting service. Grafana’s alerting service is more closely connected with its dashboarding and visualization. It lets users create custom alert rules based on metric thresholds or data visualizations directly from the Grafana interface. When an alert is activated, Grafana promptly sends notifications via channels such as email, Slack, or PagerDuty, ensuring proactive monitoring and swift resolution of critical issues.
Dashboarding and Data Visualization
Prometheus lacks at dashboarding visualization, but It provides a basic expression browser that allows users to visualize metrics in a tabular format and plot simple time-series graphs. It provides a time filter but Prometheus may not be able to handle more advanced visualization requirements. On the other hand, Grafana offers rich and customizable dashboards and a user-friendly interface to allow users to design visually appealing dashboards by combining data from many sources like MySql, Elastic Search and etc. Grafana can present the data with a wide range of visualizations such as line charts, bar charts, pie charts, etc. It also offers a wide range of customization options, going beyond simple visualization. Users are able to define variables and use templates that allow them to create dynamic dashboards. This visualization tool also promotes collaboration and information sharing by enabling users to share dashboards with team members or the larger community.
Community and Support
Both Prometheus and Grafana have a committed community of users and developers who actively contribute to its development as an open-source project and offer support. Users can ask for assistance, share information, and discuss best practices on discussion boards, mailing lists, and forums. These platforms are valuable tools for resolving issues, finding specialized information, and picking the brains of other community members. In addition, both the Prometheus and Grafana community continuously updates the official documentation, which offers thorough instructions on Prometheus installation, configuration, and usage. The documentation ensures customers have accurate and current information at their disposal by covering a variety of Prometheus features, such as querying, alerting, and integration with other tools. In this case, the comparison between Prometheus vs. Grafana reveals the strong support and extensive resources available through their active user communities and comprehensive documentation.
Use Cases of Prometheus
This versatile monitoring and alerting tool offers a wide range of use cases that cater to different environments and scenarios.
Kubernetes & Docker Swarm monitoring: Prometheus is an excellent option for monitoring containerized environments like Kubernetes and Docker Swarm due to its natural integration with them. It can gather metrics from the orchestration layer, including metrics on cluster resources, pod health, node performance, and scaling events. This helps dev-ops to have a better plan for capacity, automate scaling, and identify and address problems affecting containerized workloads.
Microservices and Cloud-Native Monitoring: Prometheus excels at monitoring complex distributed systems such as Microservice architecture and Cloud-Native environments. It can combine information from multiple sources, scrape them, generate alerts based on predefined thresholds, and assist in maintaining the system’s overall health and performance.
DevOps Monitoring: Prometheus works effectively with DevOps techniques, allowing monitoring and observability across the development and deployment lifecycles. In DevOps setups, it can be used to identify bottlenecks, monitor performance trends, and simplify troubleshooting.
Use Cases of Grafana
This popular open-source data visualization and monitoring tool includes a variety of use cases in real-world problems. Here are a few examples:
Operational Monitoring: Grafana is excellent at visualizing operational data, allowing teams to monitor infrastructure, networks, and apps in real-time. It can combine information from several sources, like Prometheus, Elasticsearch, and InfluxDB, to create detailed dashboards for improved operational visibility.
Business Intelligence: This tool is an effective tool for business intelligence because of its flexible data visualization features. It can connect to a variety of data sources, including databases, APIs, and cloud platforms, to build dynamic dashboards and reports. This enables business users to track business metrics, get insights into key performance indicators, and make data-driven decisions.
IoT Monitoring: Grafana is an excellent option for monitoring IoT devices and sensors by using its rich visualizations. It makes it possible to track sensor readings, environmental conditions, and other IoT data in real-time, assisting businesses in making decisions and spotting abnormalities in the IoT ecosystem.
Grafana and Prometheus: Working Together
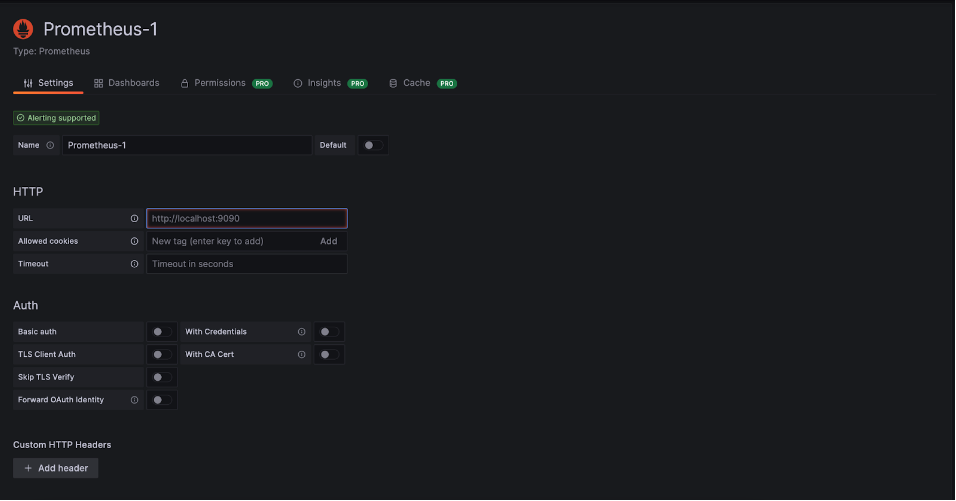
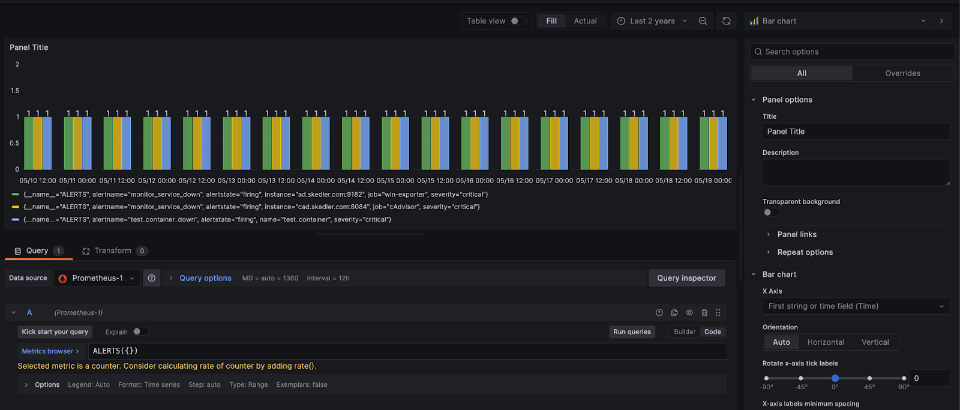
Grafana and Prometheus are often used together to create a powerful monitoring and observability solution. While Prometheus specializes in metrics collection, storage, and alerting, Grafana excels in data visualization and dashboarding. Since Grafana is not restricted to supporting a single data source like Prometheus, users can use Grafana to solve the issues that Prometheus has. For instance, Grafana enables users to do advanced analytics on Prometheus metrics by applying functions, transformations, and aggregations to gain deeper insights into their data and identify trends or anomalies. Also, with Grafana dashboards, users can enhance the Prometheus alerts capabilities by setting alert panels to monitor live alerts, acknowledge alerts, and view alert history in a visually rich and interactive platform. To visualize Prometheus data in Grafana visualization, users need to connect the Prometheus server as a data source and use it in the Grafana panels, as shown below.
Conclusion
Grafana and Prometheus are powerful tools that work well together in the ecosystem of monitoring and observability. Prometheus manages its collection, storage, and analysis of time-series data, while Grafana offers a flexible and user-friendly interface for visualizing and engaging with data from different data sources. So we can’t really say one is superior to the other. But while deciding between Prometheus and Grafana, consider your specific monitoring requirements.
Both tools offer valuable features and can be integrated to create a thorough monitoring and visualization solution that is specific to your needs. So, If you primarily need to gather and store time-series data and require an integrated alerting system, Prometheus is a good choice. It works well in dynamic situations, server metrics, and infrastructure monitoring. If your primary goals are data visualization, investigation, and the creation of educative dashboards, Grafana is the tool to consider. It supports integration with various data sources, including Prometheus, making it versatile for visualizing metrics from multiple systems. Grafana excels in tracking business goals and objectives, application performance, and visually appealing data displays.
If you found this article interesting, we invite you to follow Skedler on LinkedIn, Twitter, and Facebook and browse our blog to find other topics of interest. If you work with tools like Grafana and Kibana and are looking for a solution to automate your reports, we invite you to try Skedler.