August 21st, 2023
Grafana Essentials: Creating Dashboard Reports for Data Analysis
Welcome to another insightful blog post from Skedler! In today’s post we’ll dive into the world of data analytics with Grafana, an incredibly powerful tool for visualizing and tracking data using customizable dashboards We will cover the essentials of dashboard reporting that gives you power if you make informed decisions based on your data.
In addition, we will introduce you to Skedler, a tool that can enhance your reporting capabilities in Grafana. Let’s get started!
Automate your  Grafana and
  Kibana Reports Today!Reporting Made Simple.
Understanding Grafana: Your Gateway to Data Visualization
Grafana is an open-source analytics visualization platform that helps you understand your data through customizable interfaces and dashboards. It supports multiple data sources, making it versatile for applications, including performance management, data analytics, and more. Here is a breakdown of what is needed to create effective Grafana dashboard reports:
1. Data Source Sonfig
Before you start creating dashboards, you need to connect Grafana to your data source. Grafana also supports databases, cloud services, and time series databases. Popular data sources include Prometheus, MySQL, InfluxDB, and Elasticsearch. Once connected, you can harness the power of your data to create insightful visualizations.
2. Create Dashboards
Creating a new dashboard is as easy as a few button clicks. Start by clicking “Create” on the main dashboard page, then add panels to your dashboard. Panels are individual graphs that represent data in various forms, such as graphs, tables, heat maps, and much more.
3. Visualization Types
Grafana offers many visualization options to suit your data analysis needs. Some common types are:
- Graphs: Models for time series data, graphs show trends, anomalies and patterns.
- Tables: Display raw data with filtering, sorting and formatting options.
- Gauges: Represent data as single objectives or indicators of progress.
- Heatmaps: Perfect for presentation or classification charts in large data sets.
4. Dashboard Layout and Templating
Use the grid layout to arrange your panels in the dashboard. You can also use templating to create dynamic dashboards that allow users to change variables, filters, or time intervals on the fly. This feature is particularly useful when analyzing different sub-data.
5. Alerting and Explanations
Grafana enables you to configure alerts based on specific conditions. You get notifications when your data crosses borders, making sure you’re always aware of important changes. Annotations allow you to mark specific information in your graphs, and provide context for your data.
Skedler: Elevating Your Grafana Experience
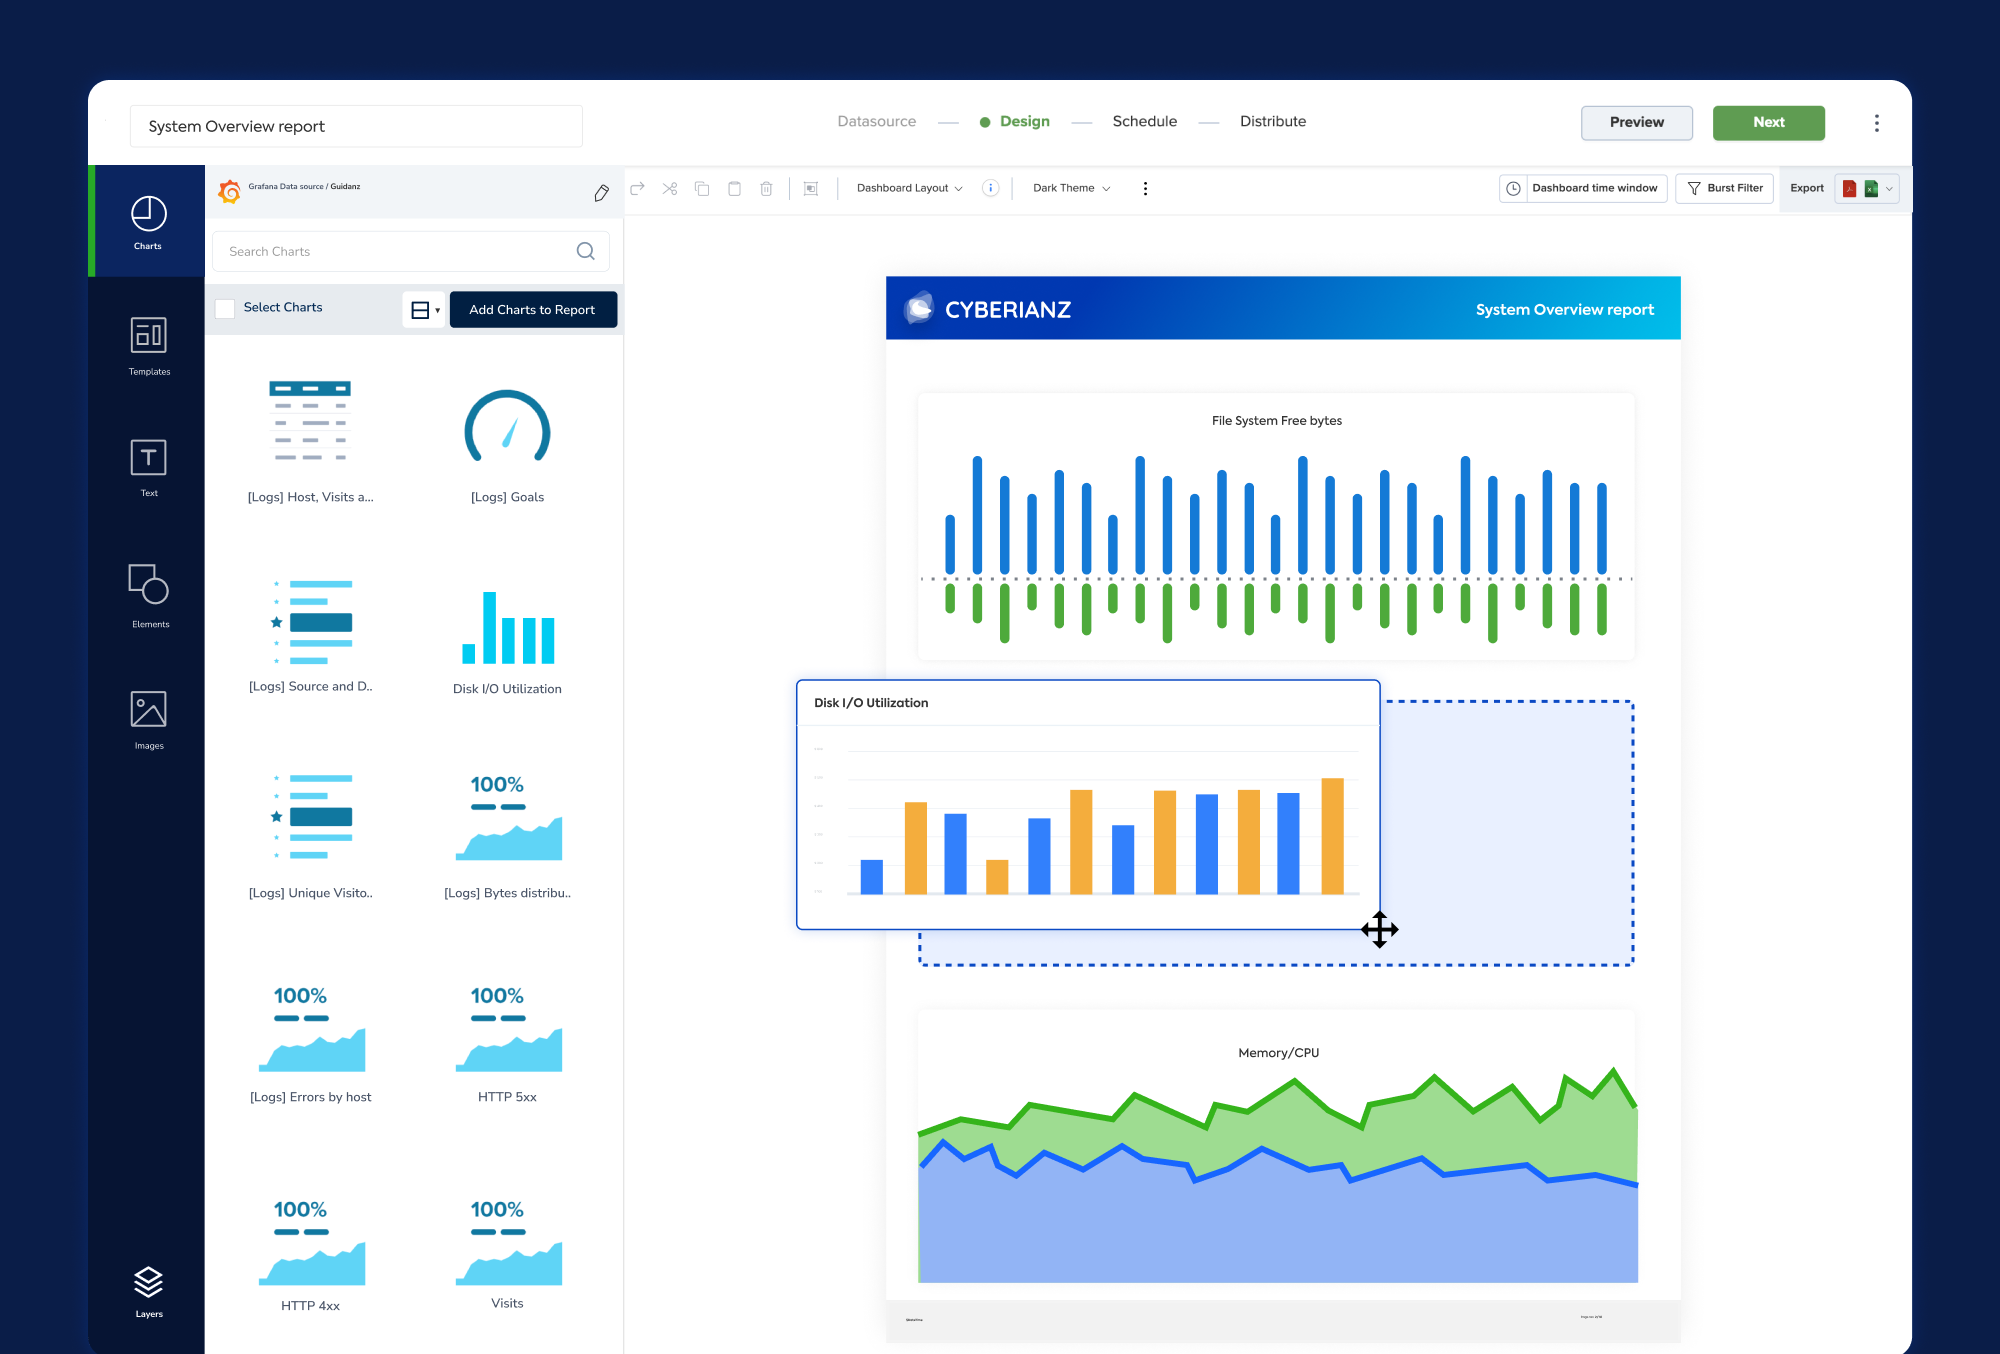
While Grafana excels at real-time visualization, there are cases where you need to create, organize, and provide your own dashboard-based reporting. This is where Skedler comes into play, increasing your reporting capabilities in Grafana.
Automatic Report Generation
Skedler lets you customize the process of generating reports from your Grafana dashboard. Whether it’s a weekly performance summary or a monthly data analysis report, you can configure Skedler to generate this report at a specific time.
Adaptable Designs
Create beautiful custom templates that align with your organization’s logo. Skedler allows you to customize fonts, colors, logos, and more, ensuring that your reports are not only informative but also visually consistent with your brand identity.
Planned Distribution
With Skedler, you can schedule notifications to specific customers via email, Slack, or other communication channels. This means stakeholders and team members can access the latest insights without having to go directly to the dashboard.
Compliance and Auditing Procedures
Skedler’s features address compliance and auditing requirements. To ensure transparency and accountability, you can keep records of when reports were created, sent, and received.
Conclusion
In the world of data analytics, Grafana stands out as a versatile and powerful tool for creating interactive dashboards. Its ability to visualize complex data sets enables users to make data-driven decisions. And with integrated Skedler, you can take your reporting capabilities to the next level by automating report generation and delivery.
All you need to do is Download Skedler and try it for free today!
Whether you’re managing business presentations, analyzing trends, or choosing strategies, Grafana and Skedler have you covered. Stay tuned for more insight from Skedler – you can find us on Twitter, LinkedIn and Facebook.