Grafana dashboards to PDF/CSV reports – No code transformation.
Have you wondered why Grafana is so widely adopted? Grafana is a unique open-source solution used for the analysis of massive sets of data and monitoring servers or applications. One of the most useful features is the customizable dashboards. Grafana dashboards allow efficient visualization and analysis of organized time-series data from multiple data sources. Some supported data sources include AWS CloudWatch, Elasticsearch, Azure Monitor, InfluxDB, MSSQL, Prometheus, etc.
A Grafana dashboard is a collection of multiple panels arranged in rows. These dashboards organize and make sense of complex data in real-time. The most common use cases of Grafana dashboards include server monitoring, weather forecasting, performance testing, billing forecasting, and much more. These sharable dashboards make it easier for teams to collaborate with the available information.
Why do you need to convert Grafana Dashboards into reports?

Organizations utilizing Grafana dashboards face the challenge of disseminating critical data to diverse stakeholders who may not have direct access or the inclination to engage with the dashboards. The transformation of dashboards into shareable reports emerges as a pivotal solution, offering a range of benefits:
-
Expanded Data Access: Reports unlock valuable information from Grafana dashboards, making it accessible to a wider audience.
-
Decision-Making Without Dashboards: Stakeholders can make informed business decisions even without direct Grafana access, thanks to user-friendly reports.
-
Full Picture of Time-Sensitive Data: Reports offer insights into both past and real-time data, providing a complete view crucial for planning.
-
Continuous Improvement Analysis: Teams can use reports to spot areas for improvement and track essential aspects of the business.
-
Enhanced Transparency: Reports replace assumptions with clear data, fostering transparency and understanding of ongoing events.
-
Informed Decision-Making: Reports serve as a reliable foundation for decision-making, offering data-driven insights for better, informed choices.
Therefore, businesses of all sizes distribute Grafana information to stakeholders internally within their companies and externally to their clients through reports. By delivering the right information to the right users at the right time, reports help Grafana users to make informed decisions and better manage their business operations.
Converting a Grafana Dashboard into Reports
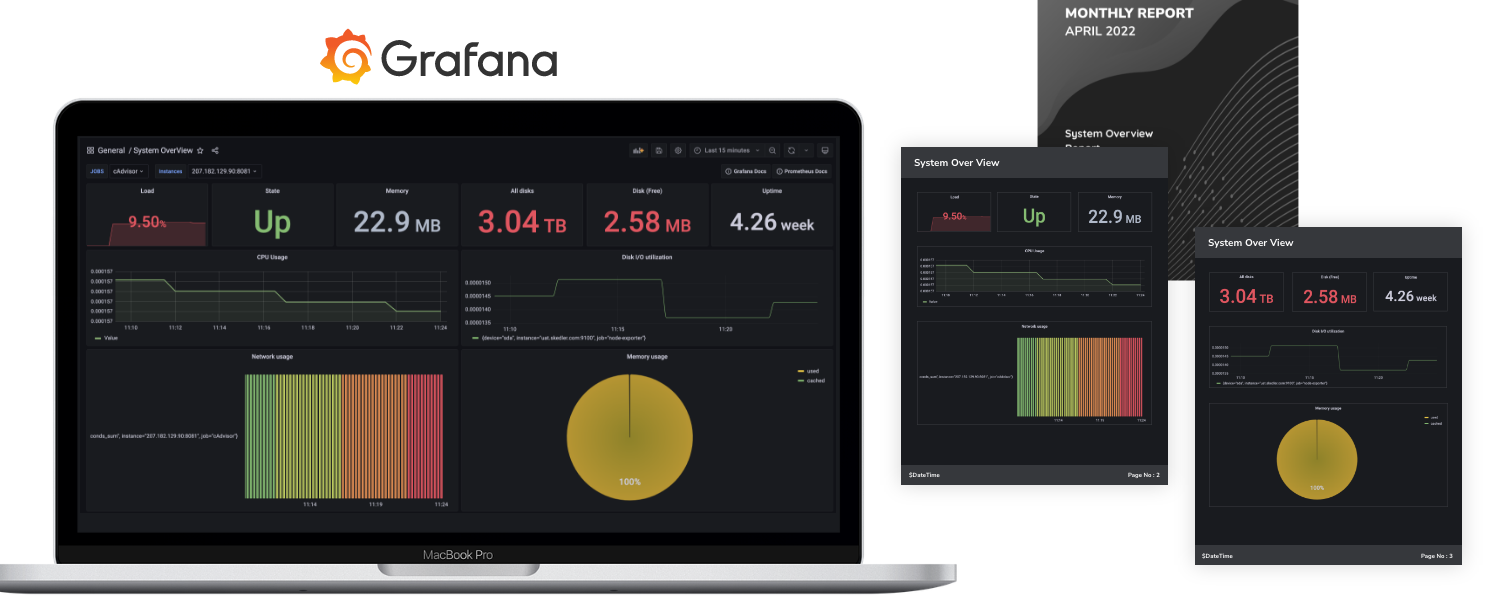
There are two primary methods for converting a Grafana dashboard into reports:
Code-it-Yourself Solution:
By writing your own code to generate Grafana PDF/CSV reports, you gain flexibility and personalization tailored to your agency’s specific functionalities and business data. However, this method comes with notable challenges:
-
- Considerable time, money, and effort investment.
- The need for multiple codes to distribute reports to different stakeholders.
- Technical proficiency required for software creation, maintenance, updates, and issue resolution.
- Limited support, forums, or online community assistance.
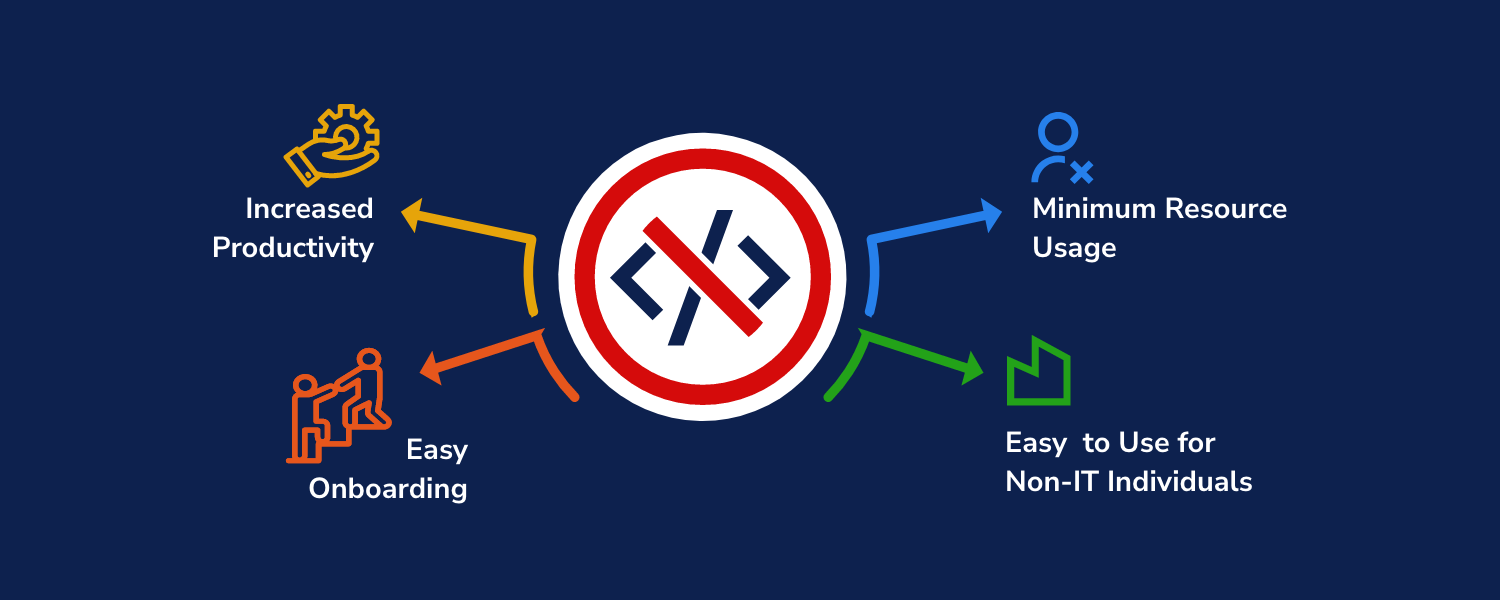
Given these challenges, a no-code solution becomes imperative to streamline and automate the reporting process.
No-code Solution:
Grafana Reporting
- Enables the creation of PDF or CSV reports from one or more Grafana dashboards.
Allows scheduled report delivery via SMTP to a predefined set of recipients.
Limitation: Inability to share selected panels from a specific dashboard; entire dashboard content is included in the report.
Skedler
- Exclusively designed as a custom report automation tool for Grafana and Kibana.
- Offers the creation of multiple reports from a single dashboard, providing enhanced flexibility compared to Grafana reporting.
- Simplifies the process by allowing the addition of required dashboard panels to each report.
- Unique customization options:
- Select report formats: PDF, PNG, HTML Inline, Excel, and CSV.
- Design branded reports following the company’s style guide using the Report Designer.
- Set custom schedules, including holiday schedules, for each report.
- Share reports via Outlook, Gmail, SMTP server, or Slack.
Why Skedler?

Skedler is a cost-effective and reliable solution dedicated to the seamless transformation of Grafana dashboards into detailed reports. It is the favorite automation tool for people working with Grafana reports. It is intuitive and easy to use, and ensures a smooth user experience. The inclusion of SSL encryption ensures a secure channel for communication, while LDAP integration provides a seamless authentication process for users.
Skedler boasts unique features, including innovative report templates, report scheduler and burst filters, which contribute to efficient and streamlined reporting. It is also under continuous development. In 2023 Skedler expanded its distribution capabilities by enabling the dissemination of Skedler Reports through Amazon Web Services (AWS) Simple Storage Service (S3) buckets. This enhancement adds a new dimension to Skedler’s flexibility and accessibility, giving users an additional option to seamlessly share and store reports. With Skedler, not only does professionalism shine through in every report, but users can also have confidence in the accuracy and security of the reports delivered.
Eager to explore the capabilities of Skedler? Well, now is your chance! Start your 15-day trial today and uncover how Skedler can elevate your reporting processes. For those inquiring about pricing details, kindly request a quote, and we will promptly provide the information you seek. Additionally, if a closer examination or clarification of Skedler’s capabilities is desired, our team stands ready to conduct a thorough demo. Take the initial step towards enhancing your reporting efficiency—start your Skedler journey today!