November 30th, 2021
Observability 101 – How is it Different from Monitoring
Monitoring IT infrastructure was, in the past, a fairly complicated thing, because it required constant vigilance: software continuously scanned a network, looking for outages, inefficiencies, and other potential problems, and then logged them. Each of these logs would then have to be checked by a qualified SOC team, which would then identify any issues. This led to several common problems, such as alert fatigue and false flags – both of which we’ll discuss more later – and burnout was prevalent. In fact, these three issues (fatigue, flags, and burnout) have only increased as our interconnectivity has increased. Much like the pitfalls that have befallen the airline industry (such as increased security risks and tougher identification and authorization measures), our increasing connectivity is also presenting increased security risks, risks that require more stringent identification and authorization measures, adding to the workload of SOC teams.

What does monitoring do? It lets us know if there are latency issues; it lets us know if we’ve had a jump in TCP connections. And while these are important notifications, they are no longer enough. Secure systems do not remain secure unless they are also maintained. Security teams need a system that can monitor all of these interconnected components. This is where observability comes in.
What is monitoring?
Observability is the capacity to deduce a system’s internal states. Monitoring is the actions involved in observability: perceiving the quality of system performance over a time duration. The tools and processes which support monitoring can deduce the performance, health, and other relevant criteria of a system’s internal states. Monitoring specifically refers to the process of analyzing infrastructure log metrics data.
A system’s observability lets you know how well the infrastructure log metrics can extract the performance criteria connected with critical components. Monitoring helps to analyze the infra log metrics to take actions and deliver insights.
If you want to monitor your system and keep all the important data in a place Grafana will help you organize and visualize your data! To know more about Grafana check this blog
What is Observability?
Observability is the capacity to deduce the internal states of a system based on the system’s external outputs. In control theory, observability is a mathematical dual to controllability, which is the ability to control the internal states of a system by influencing external inputs.
Infrastructure components that are distributed operate in multiple conceptual layers of software and virtualization. Therefore it is not feasible and challenging to analyze and compute system controllability.
Observability has three basic pillars: metrics, logs, and tracing. As we noted a moment ago, observability employs all three of these to create a more holistic, end-to-end look at an entire system, using multiple-point tools to accomplish this.
Comparing observability and monitoring
People are always curious about observability and its difference from monitoring. Let’s take a large, complex data center infrastructure system that is monitored using log analysis, monitoring, and ITSM tools. Monitoring multiple data points continuously will create a large number of unnecessary alerts, data, and red flags. Unless the correct metrics are evaluated and the redundant noise is carefully filtered monitoring solutions, the infrastructure may have low observability characteristics.
A single server machine can be easily monitored using metrics and parameters like energy consumption, temperature, transfer rates, and speed. The health of internal system components is highly correlated with these parameters. Therefore, the system has high observability. Considering some basic monitoring criteria, such as energy and temperature measurement, the performance, life expectancy, and risk of potential performance incidents can be evaluated.
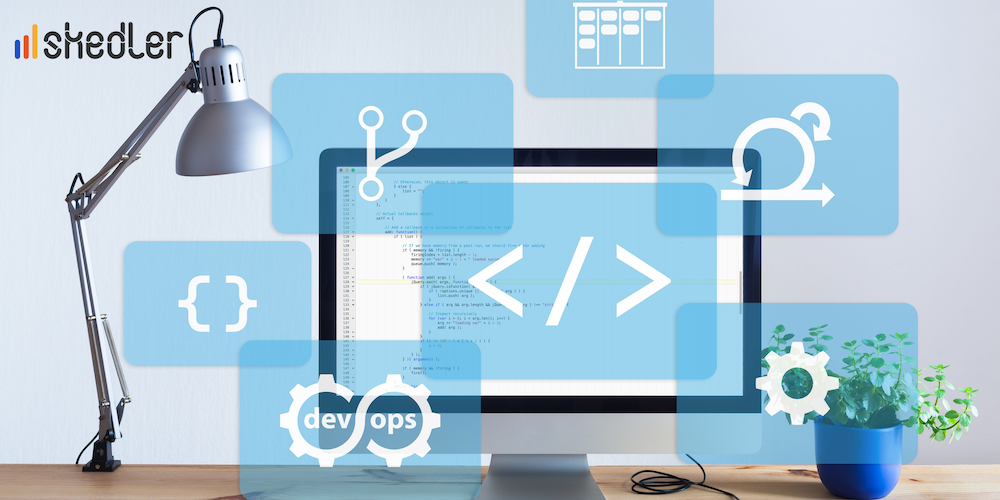
Observability in DevOps
The concept of observability is very important in DevOps methodologies. In earlier frameworks like waterfall and agile, developers created new features and product lines while separate teams worked on testing and operations for software dependability. This compartmentalized approach meant that operations and monitoring activities were outside the development’s scope. Projects were aimed for success and not for failure i.e debugging of the code was rarely a primary consideration. There was no proper understanding of infrastructure dependencies and application semantics by the developers. Apps and services were built with low dependability.
Monitoring ultimately failed to give sufficient information of the distributed infrastructure system about the familiar unknowns, let alone the unfamiliar unknown.
The popularity of DevOps has transformed SDLC. Monitoring is no longer limited to just collecting and processing log data, metrics, and event traces but is now used to make the system more transparent I.e observable.
The scope of observability encapsulates the development segment which is also aided by people, processes, and technologies operating across the pipeline.
Conclusion
Collaboration of cross-functional teams such as Devs, ITOps, and QA personnel is very important when designing a dependable system. Communication and feedback between developers and operations teams are necessary to achieve observability targets of the system that will help QA yield correct and insightful monitoring during the testing phase. In turn, DevOps teams can test systems and solutions for true real-world performance. Constant iteration based on feedback can further enhance IT’s ability to identify potential issues in the systems before the impact reaches end-users.
Observability has a strong human component involved, similar to DevOps. It’s not limited to technologies but also covers the approach, organizational culture, and priorities in reaching appropriate observability targets, and hence, the value of monitoring initiatives.
Keep your system as transparent as possible, track your system health and monitor your data with Grafana or Kibana. Also, keep your Stakeholders happy with professional reporting! Try our new and improved Skedler for custom generated Grafana reports for free!