Three Pillars of Observability – Metrics ( Part 2)
Introduction
Distributed systems mean services and servers are spread out over multiple clouds. The individual users who consume the services increase their number, device of choice, and location. Having visibility into the client’s experience while using the application – i.e., observability – is now a vital part of the metrics required to operate the applications in your infrastructure.
What is Metrics?
A metric is a quantifiable value measured over a while and includes specific characteristics like timestamp, name, KPIs, and value. Unlike logs, metrics are structured by default, making it easier to query and optimize for storage giving you the ability to retain them for more extended periods.
Metrics help uncover some of the most primary queries of the IT department. Is there a performance issue that’s affecting customers? Are employees having trouble accessing? Is there high traffic volume? Is the rate of customer churn going up?
Standard metrics include
- System metrics such as CPU usage, memory usage, disk I/O,
- App metrics such as rate, number of errors, time,
- Business metrics such as revenue, signups, bounce rate, cart abandonment, etc.
Different Components of Metrics
Metrics is the most valuable of the three pillars because they’re generated very often and by every module, from operating systems to applications. Associating them can give you a complete view of an issue, but associating them is a huge and tedious task for human operators.
Data Collection
The most significant part of metrics is small and does not consume too much space. You can gather them cheaply and store them for an extended period. These give you a general overview of the whole system without insights.
So, metrics answer the question, “How does my system performance change through time?”
Data Storage
Most people used statsd along with graphite as the storage backend. Some people now prefer Prometheus, an open-source, metrics-based monitoring system. It does one thing pretty well, with a simple yet powerful data model and a query language, it lets you analyze how your applications and infrastructure perform.
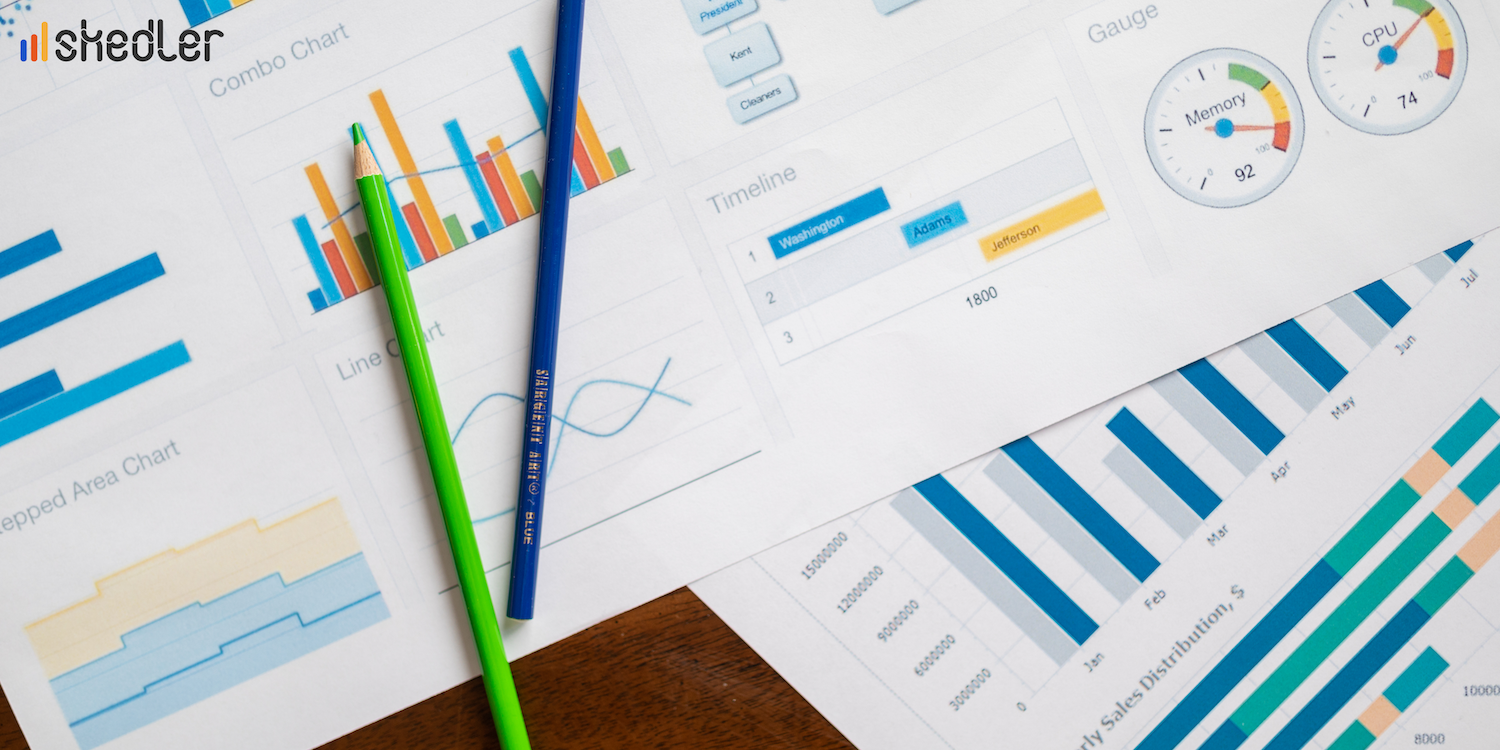
Visualization and Reporting
I would also consider visualization a part of metrics, as it goes hand in hand with metrics.
Grafana is used to visualize the data scraped by sources like Prometheus, a data source to grafana, which works on a pull model. You can also use Kibana as your visulaization tool, primarily supporting elastic stack.
And you can use Skedler to generate reports from these visualizations to share with your stakeholders.
There is a simple and effective way to add reporting for your Elasticsearch Kibana (including Open Distro for Elasticsearch) or Grafana applications that are deployed to Kubernetes using Skedler.
You can deploy Skedler on air-gapped, private, or public cloud environments with docker or VM on various flavors of Linux.
Skedler is easy to install, configure and use with Kibana or Grafana. Skedler’s no-code Drag-n-drop UI generates PDF, CSV, Excel Kibana, or Grafana reports in minutes and saves up to 10 hours per week.
Try our new and improved Skedler for custom generated Grafana or Kibana reports for free!
Conclusion
Metrics are the entry point to all monitoring platforms based on the data collection from CPU, memory, disk, networks, etc. And so, they no longer belong only to operations — metrics can be created by anyone and any system in the distributed network. For instance, a developer may opt to showcase application-specific data such as the number of tasks performed, the time required to complete the tasks, and the status. Their objective is to link these data to different levels of systems and define an application profile to identify the necessary architecture for the distributed system itself. This adds to improved performance, reliability, and better security system-wide.
Metrics used by development teams to identify points in the source code that need improvement can also be used by operators to assess the system requirements and plan needed to support user demand and the team to control and enhance the adoption and use of the application.